Measurement Computing eZ-NDT version 6.0.9 User Manual
Page 14
2-8 Investigation Mode Testing
938691
eZ-NDT
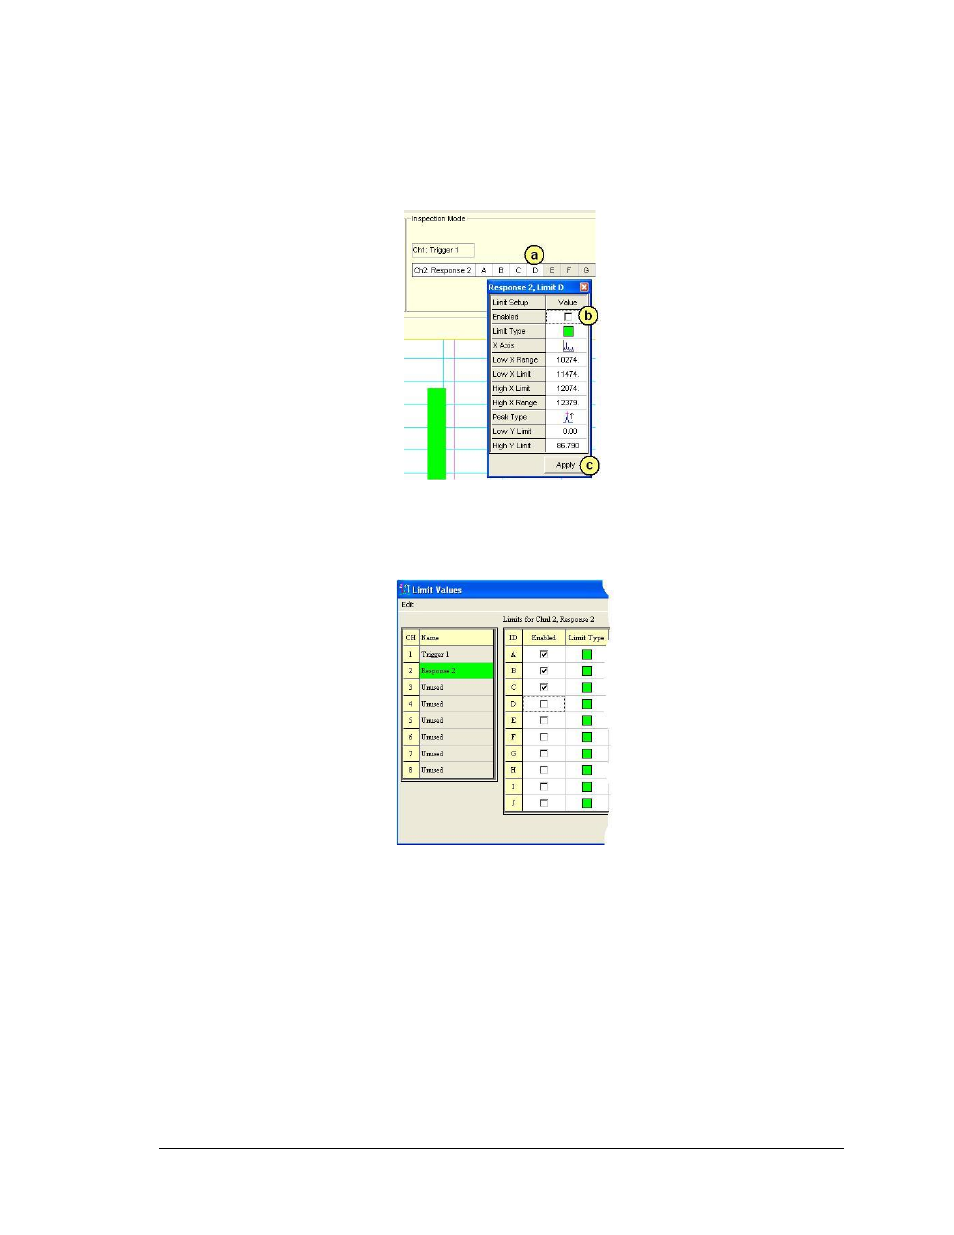
To remove a Limit Band from the plot:
a) Right-click on the Limit Band’s associated letter. Each enabled limit band has a letter in a white box
(see figure).
A property box will appear. In the figure below Limit D is being selected.
b) Remove the checkmark from “Enabled.”
c) Click the
Removing a Limit Band
Note: Limit bands can also be added or removed via the “Limits” selection within the Edit pull-down
menu. The difference in using the Edit menu’s “Limits” selection is that all properties (for all limit
bands) are displayed at the same time [instead of one at a time]. See following figure.
Limit Values Window, Partial Display
Limit Bands can be “Enabled” and “Disabled” from the first column.
To add a Limit Band to the plot:
a) Right-click on a disabled Limit Band’s associated letter. Note that disabled limit bands are designated
as letters in gray boxes
A property box will appear.
b) Add a checkmark to the “Enabled” property.
c) Click the