Preparing reports …… 3-4, Preparing reports – Measurement Computing eZ-NDT version 6.0.9 User Manual
Page 20
3-4 Inspection Mode Testing
938691
eZ-NDT
Preparing Reports
After each NDT inspection, the test results are stored in the history file. This is a FIFO, “First-In,
First-Out”file.
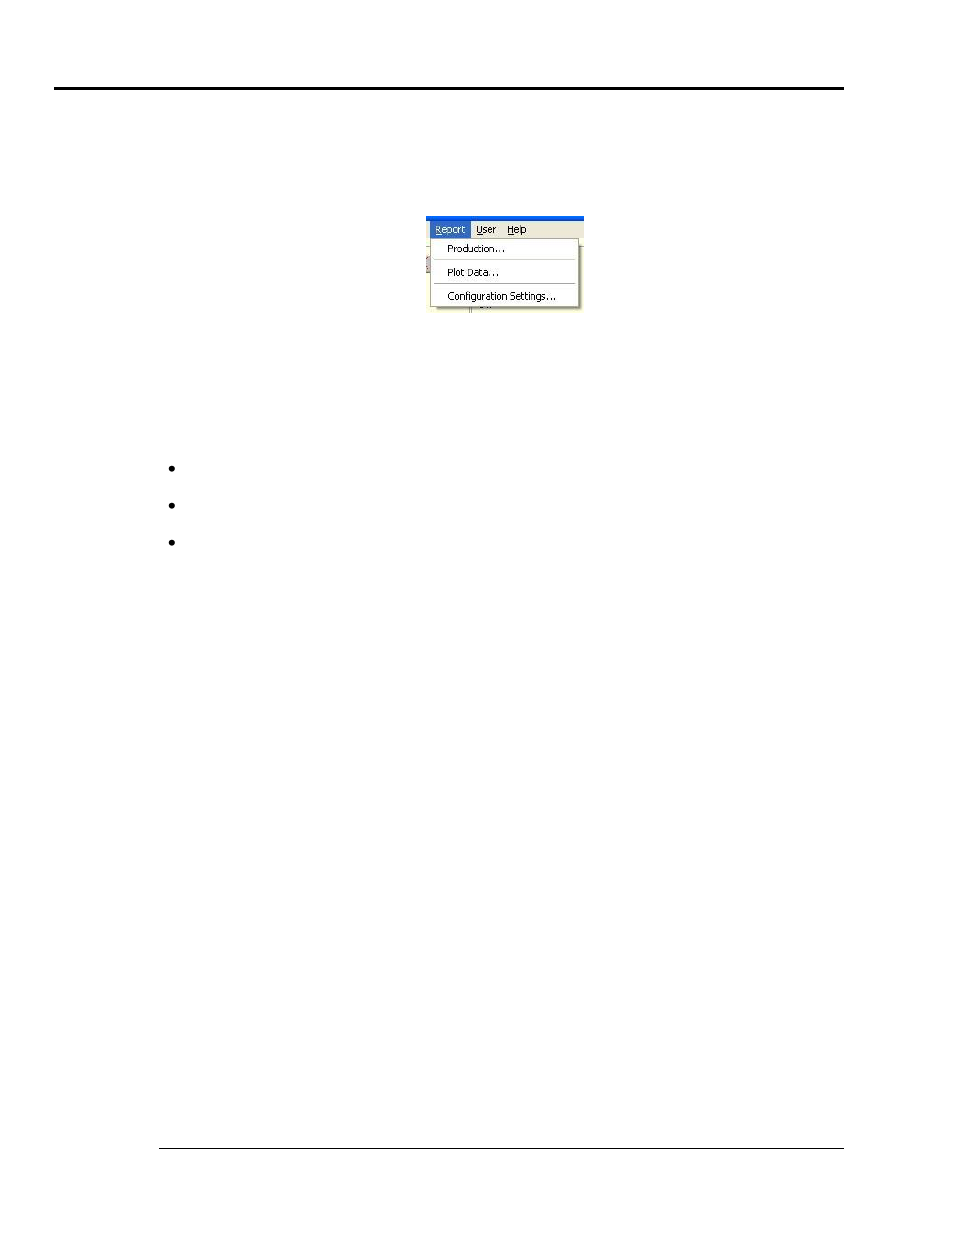
eZ-NDT is capable of generating three types of reports from this history file: Production, Plot Data, and
Configuration Settings.
Report Pull-down Menu
The reports are text files. After selecting a report type, you will be prompted to enter a filename for the text
file using a standard Windows dialog box. The features of the three report types are as follows:
Production Report – After choosing Production from the Report menu, a production report dialog box
opens. It displays two radio buttons, allowing the user to choose either a Summary or Detailed production
report.
The Summary report lists the inspection status of each part tested over the selected date and time
range. The serial number and inspector name is also listed.
The Detailed report, in addition to the information contained in the summary report, also provides the
measured frequency and amplitude peak for each spectral band on a given response channel.
Both the Summary and the Detailed Report provide a statistical summary at the bottom of the report.
The statistical summary lists the counts, average, and standard deviation values for both Passed and
Failed parts.
To the right of the production report dialog box is a graphic and a sliding scale, which both represent the
amount of data held in the project’s history file. The sliding scale allows the user to choose the amount of
data which will appear in the report. To use the sliding scale:
1. Click on the green start arrow and drag it to the desired starting percentage. The date and time of the
first data point will be displayed at the bottom of the scale.
2. Click on the red end arrow and drag it to the desired ending percentage. The date and time of the
final data point will be displayed at the top of the scale.
3. Click the
For example, if you wanted to generate a report using only the last 50% of the history file, you would drag
the green arrow to between “40” and “60” on the scale, and drag the red arrow to “100”. To use the entire
history file, leave the green arrow at “0” and the red arrow at “100”.
Plot Data Report – Choosing Plot Data from the Report menu generates a list of all the data points (using
x and y coordinates) that are displayed on the graph. The units used for the x and y coordinates in the report
will depend on whether the graph was set to the Time display or Spectrum/FRF display.
eZ-NDT can also generate a Configuration Settings report, which lists many of the configuration options
that are set in the analyzer’s configuration screen (accessible by selecting the Edit menu, and then the
analyzer hardware).