Response view, See p. 34.) – Toa DP-SP3 User Manual
Page 34
34
8.5. Response view
Select [View
Response View] from the menu or click the
Frequency response indication button on the Filter
, or
Xover View
to show or hide the Response View.
The Response View can display the Output response and Xover
response. The Xover Response View is displayed only when the filter
box is selected in the flow view.
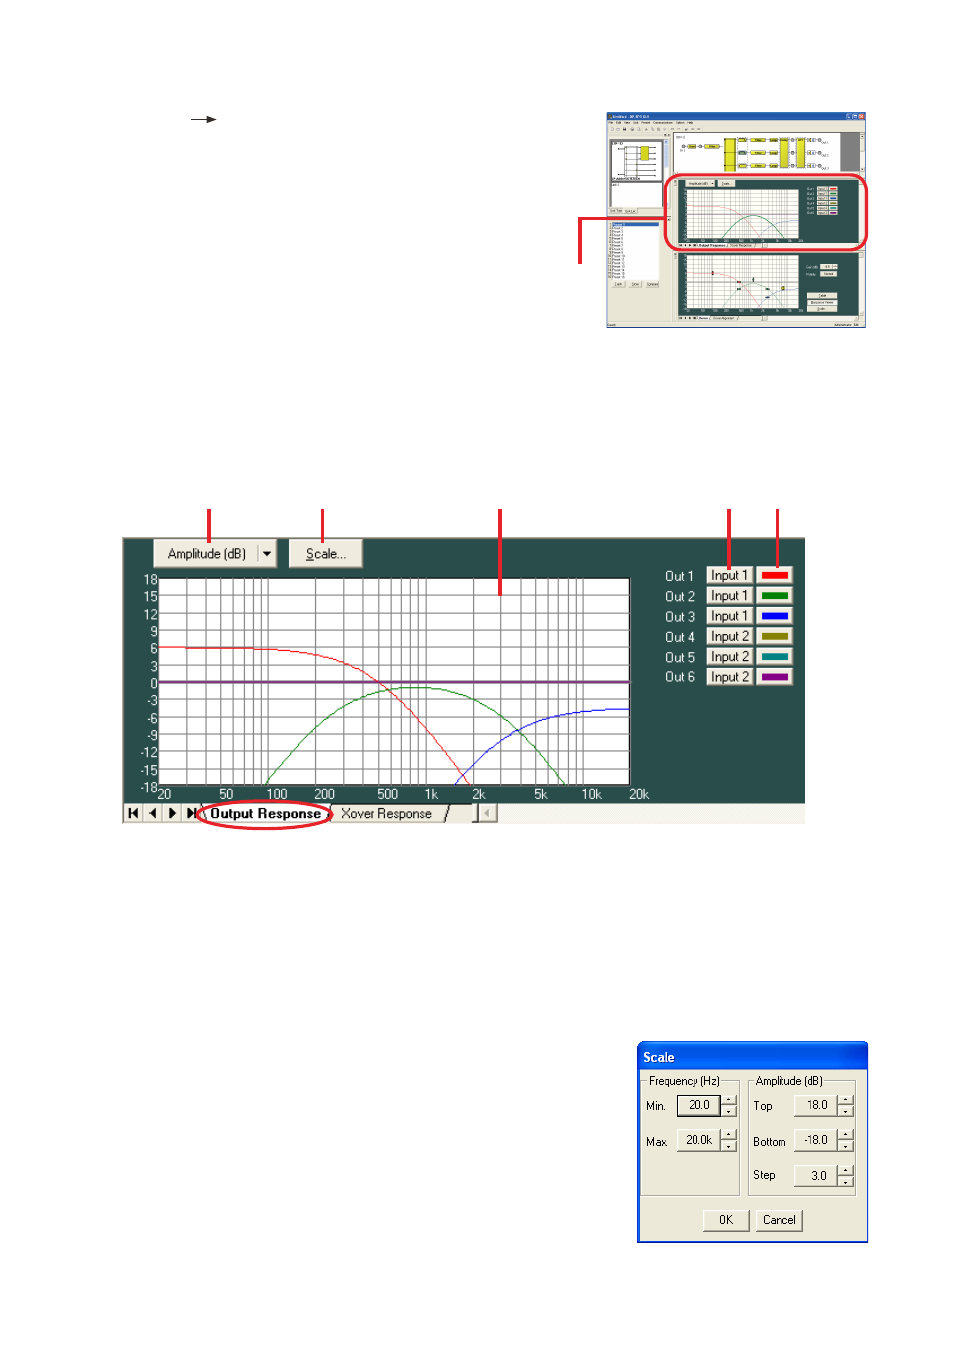
Response View
8.5.1. Output response view
Displays an overall response from input to output.
Permits selection of Inputs routed by matrix for each output channel.
Permits display of 3 types of responses: amplitude, phase and group delay responses
(1)
(2)
(3)
(4)
(5)
(1) Response indication selection button
Displays the types of frequency responses being currently displayed.
If this button is clicked, the type of frequency response to be displayed can be selected from the pull-down
menu.
There are a full-screen display that displays any one of amplitude, phase and group delay responses, and
a dual-split screen display that displays two of these 3 responses.
(2) Scale change button
If you click this button, a dialog for scale setting is then displayed
and the graph scale of the response control can be changed.
(3) Response indication area