7 centralized dashboard, Centralized dashboard – Acronis Backup for VMware 9 - User Guide User Manual
Page 34
34
Copyright © Acronis International GmbH, 2002-2013
7 Centralized Dashboard
Acronis Backup for VMware Centralized Dashboard presents the effective virtual infrastructure
monitoring tool. It allows to get current statuses of the installed single or multiple Acronis Backup for
VMware agents and to connect to the respective agents to manage them right away.
The centralized dashboard is designed to help you collect the information from several Agents to the
single web console. If you use the Acronis software on a large environment where you have 3-7
Backup for VMware agents installed, this tool can be really helpful for tracking all the agents at once.
The simple dashboard saves your time and makes your backup solution more centralized so that you
can start fixing possible issues when and where they appear.
To start using the tool you have to first install it as a virtual appliance by running the installation file
provided with the Acronis Backup for VMware installation package. Upon installing and opening the
dashboard you can add one or several Acronis Backup for VMware agents to the console. Click the
Add new button in the ribbon and specify the link to access the Backup for VMware agent (IP address,
port) as well as login credentials. The connection between the dashboard and the agent is performed
via the HTTPS secure protocol. Specify the agent name as it would appear in the list, for example
“Acronis Appliance 1”. Then click Add new.
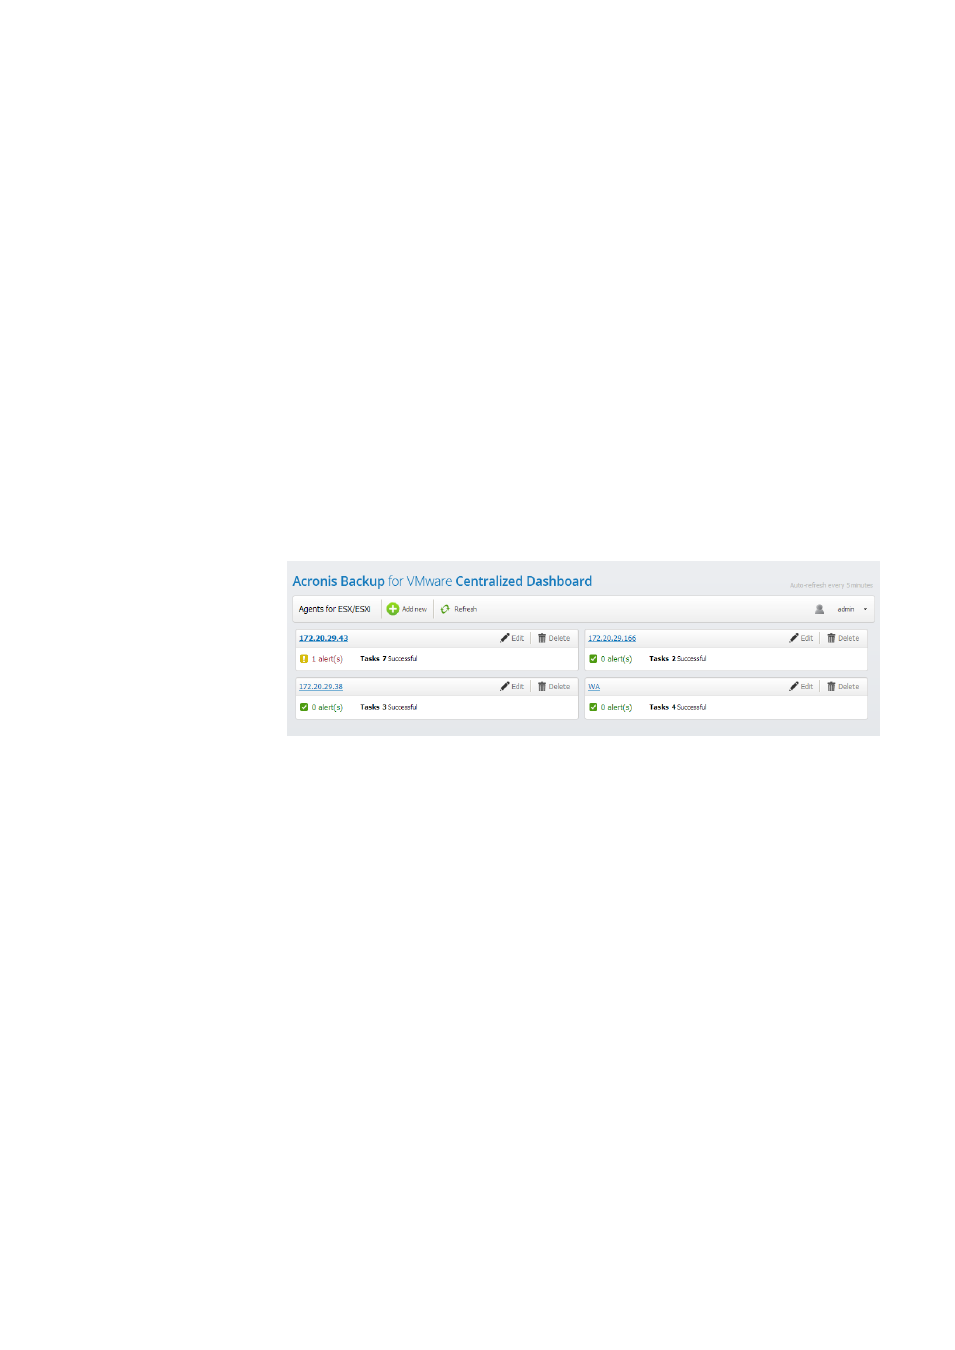
Centralized Dashboard
The dashboard shows all added Backup for VMware agents as individual plates sorted by the number
of alerts and warnings. For each agent you can change its address, port, access credentials and the
agent name by clicking the Edit button, or remove it from the dashboard by clicking the Delete
button and confirming the removal.
The dashboard shows the current status of each agent. The collected information is updated
automatically every 5 minutes, or you can manually actualize it by clicking the Refresh button.
For each agent you can see the information on its tasks and alerts.
In the alerts section you can see the color-coded current number of alerts. The red “x” sign if there is
at least one critical alert, the yellow “!” sign if there are any informational alerts (warning messages)
or the green tick sign if there are no alerts. Clicking the agent's name or it's alerts opens the
dashboard view of the respective Backup for VMware agent (the console opens in a new
tab/window). There you can check the alerts, fix the issues and dismiss alerts. The dismissed alerts
are not shown on the centralized dashboard anymore.
In the tasks section you can see the number of successful tasks, tasks with warnings and failed tasks.
By clicking them you can directly go to the tasks view of the respective Backup for VMware agent.
Equation 1: DO NOT
TRANSLATE