4 gel view – Bio-Rad Experion RNA Analysis Kits User Manual
Page 29
Technical Support: 1-800-4BIORAD • 1-800-424-6723 • www.bio-rad.com
25
To annotate a region in the electropherogram, right-click in the region and select Add Tag. In the
Edit Tag dialog, enter the annotation and click OK .
To move a tag, click and drag the label to the desired place in the electropherogram.
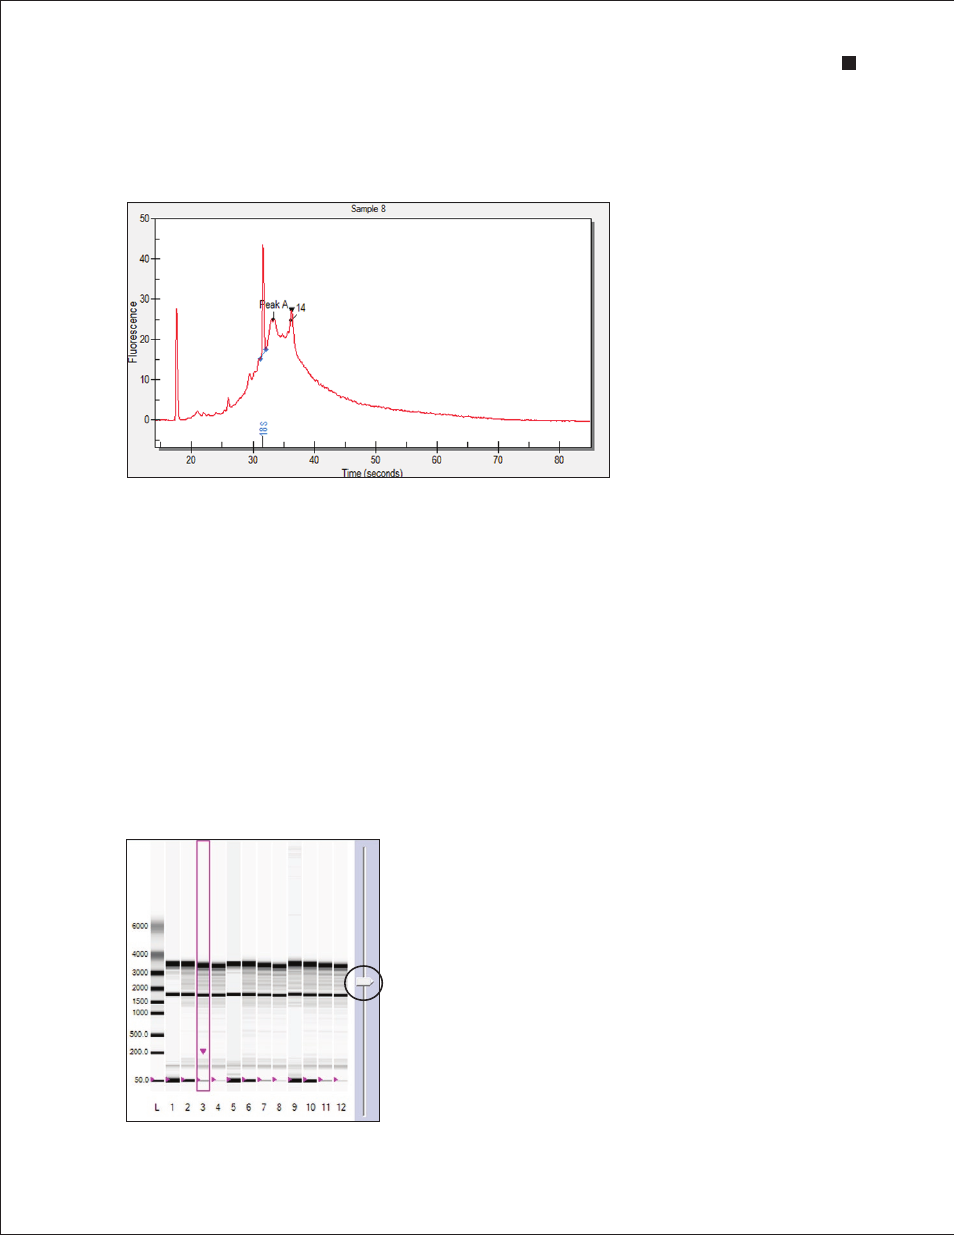
Fig . 4 .8 . Tagged (annotated) peaks in an electropherogram .
4.1.4 Gel View
Experion software converts electropherogram data into densitometric bands, which appear in the virtual
gel (Figure 4.9). Each lane of the virtual gel corresponds to a different sample, and all samples from a
chip are shown in a single gel view. When a sample is selected for view as an electropherogram, the
corresponding lane in the virtual gel is outlined in pink.
Right-click on a band to select it. A pink arrow appears above the selected band in the virtual gel, and
an inverted black arrow appears above the corresponding peak in the electropherogram. The peak
number and corresponding data also appear highlighted in the Peaks table. Only one peak can be
selected at a time.
To select a different color scheme, choose View > Gel Color and select a color from the list. By default,
the gel view displays bands as black signals on a white background.
To change the contrast of the bands, use the sliding cursor (Figure 4.9). Changing the contrast does not
change the data, but it may improve visualization of faint bands in the virtual gel.
Fig . 4 .9 . Gel view . Move the sliding cursor to adjust band intensity.
Sliding cursor
Experion RNA StdSens and HighSens Analysis Kits