Bio-Rad Experion RNA Analysis Kits User Manual
Page 26
22
Technical Support: 1-800-4BIORAD • 1-800-424-6723 • www.bio-rad.com
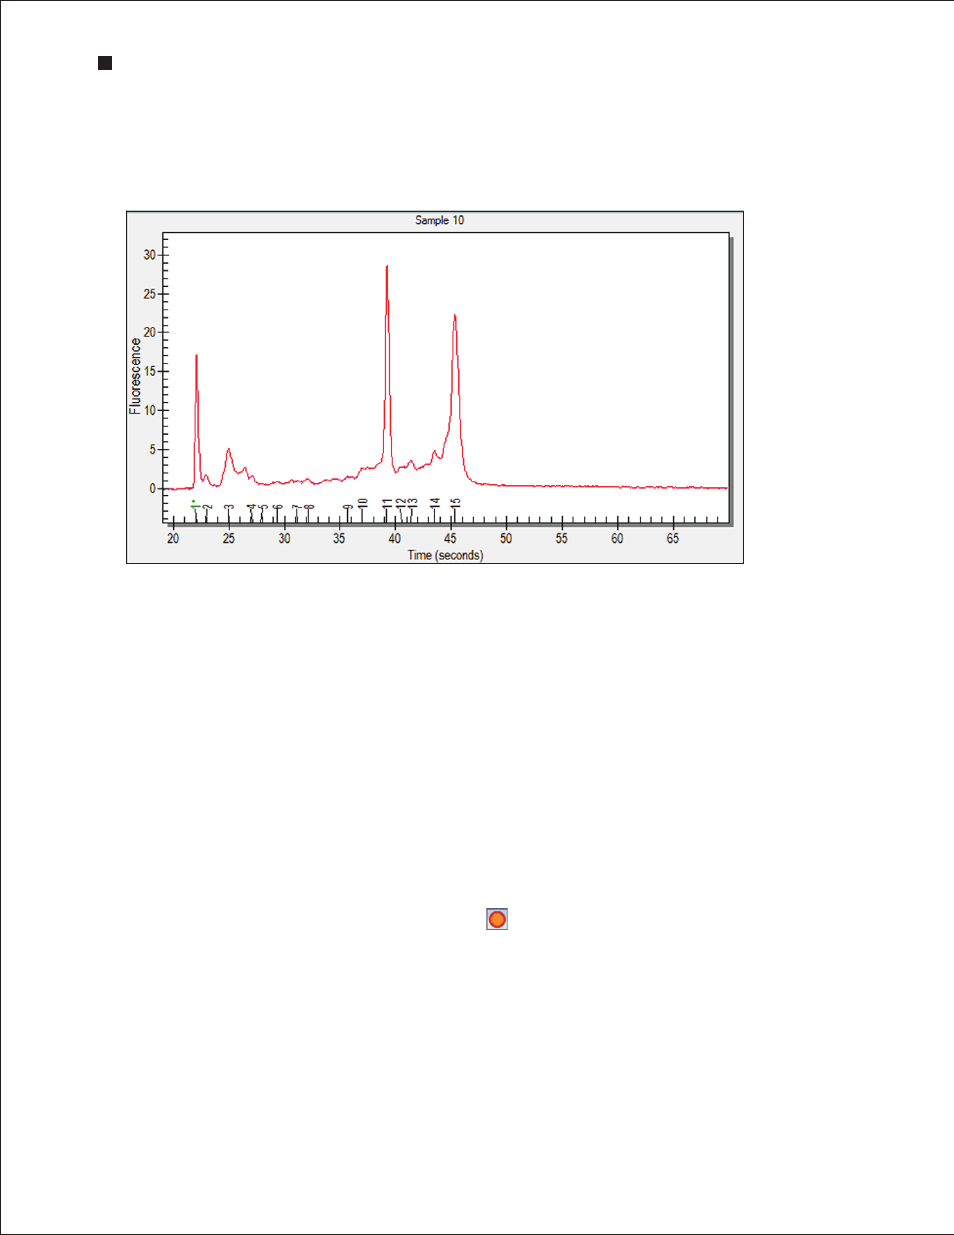
To view the peaks identified by Experion software, click Peaks in the results and settings tabs area. In
the electropherogram, all peaks identified by Experion software become numbered, and the numbers
appear under the peaks (Figure 4.4). Peaks generated by the lower marker used for normalization are
numbered and labeled in green with an asterisk (*).
Fig . 4 .4 . Example of an electropherogram from an RNA StdSens analysis of a total RNA sample .
Electropherogram displayed with the Peaks tab selected.
Double- or right-click on a peak to select it. An inverted black arrow appears above the peak in the
electropherogram, and a pink arrow appears above the corresponding band in the virtual gel. The peak
number and corresponding data also appear highlighted in the Peaks tab.
Display electropherograms in three different ways:
n
One at a time (single-well view)
n
All at once in separate windows (all-wells view)
n
As superimposed images (overlays)
Single-Well View
This is the default view, which shows the electropherogram data from a single well (Figure 4.5). To return
to this display:
1. Click on the sample in the project tree or on the corresponding lane in the virtual gel.
2. In the main screen toolbar, click View Single Well or select View > Single Well.
3. The electropherogram appears. The corresponding lane in the virtual gel is outlined in pink.
Experion Automated Electrophoresis System