5 discovering probable routes between devices, 7 the rtdaq toolbar – Campbell Scientific RTDAQ Software User Manual
Page 59
Section 4. The RTDAQ Main Screen
4.6.5.4.5 Discovering Probable Routes between Devices
You can view the probable route that communication will take between two
PakBus devices by sequentially clicking on the two devices in Pakbus Graph.
The probable communication route will be highlighted in cyan. If the Show
Hop Metrics check box is selected, the graph will include the time, in
milliseconds, that communication takes between the two devices. The results
are also displayed in the Log Messages portion of the window.
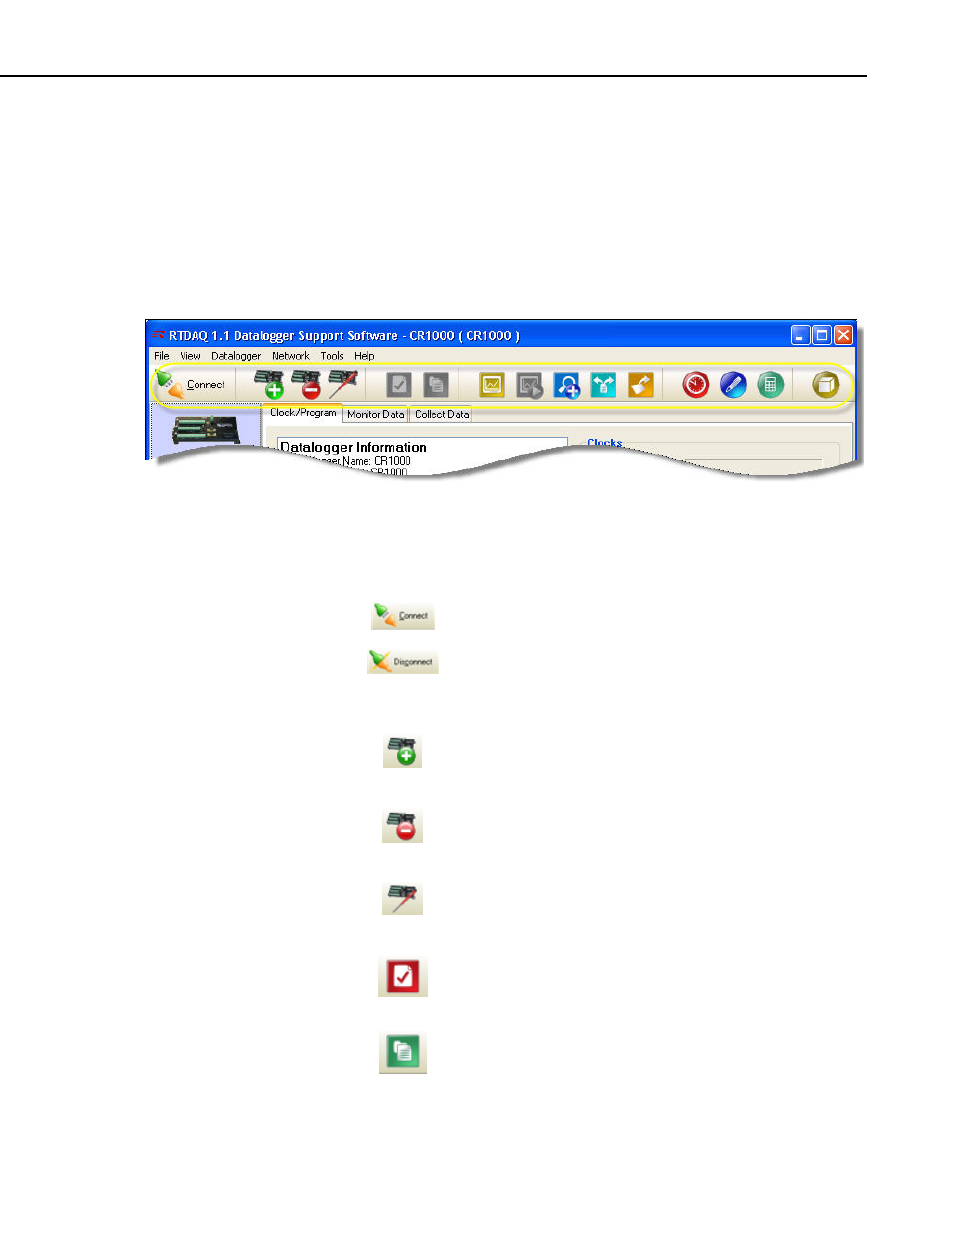
4.7 The RTDAQ Toolbar
The Toolbar gives quick access to commonly used functions. Many of the
more frequently-used functions of RTDAQ can be activated from the toolbar in
addition to the pull-down menus (as described earlier in this chapter). The
following chart explains the functionality of the toolbar:
Connect/Disconnect. Toggles and displays the connection
state. The Connect button indicates that no datalogger is
currently connected. Press this button to connect to the
currently highlighted datalogger. The Disconnect button
indicates that you are connected to the highlighted datalogger.
Press this button to disconnect.
Add Datalogger. Opens the EZSetup Wizard to add a new
datalogger to the network map. (RTDAQ must be in a
disconnected state for this button to be enabled.)
Delete Datalogger. Deletes the selected datalogger from the
network map. (RTDAQ must be in a disconnected state for this
button to be enabled.)
Edit Datalogger Setup. Opens the EZSetup Wizard to edit the
settings for the selected datalogger. (RTDAQ must be in a
disconnected state for this button to be enabled.)
Datalogger Status. Opens the datalogger status screen.
(RTDAQ must be in a connected state for this button to be
enabled.)
File Control. Opens the file control screen. (RTDAQ must be
in a connected state for this button to be enabled.)
4-23