2 data display options – Campbell Scientific RTDAQ Software User Manual
Page 175
Section 7. Monitoring Data in Real-time
With the Scaling Option section you choose the method used for determining
the maximum and minimum values on the current axis, as well as whether to
use linear scaling (equal interval scaling) or logarithmic scaling. Maximum
and minimum values can be chosen automatically depending on the data set
currently displayed, or the user can specify what the maximum and minimum
atic option to do a linear scale with the maximum and
minimum values on the scale to be automatically chosen each time the screen
may not be
values should be.
Choose the Autom
is drawn. Choose the Custom Limits option to set the values in the input
boxes of the Custom Limits section to obtain a scaling with the user-specified
maximum and minimum values. Choose the Logarithmic check box to use a
logarithmic scale for the current axis.
When using logarithmic scaling, the minimum value
NOTE
zero or less than zero.
To set up the right y-axis, select that tab from the Scaling screen. Configure
the right y-axis just as described for the y-axis above.
When you display items from two different tables, you may need
two different y-axes in order to interpret the data properly.
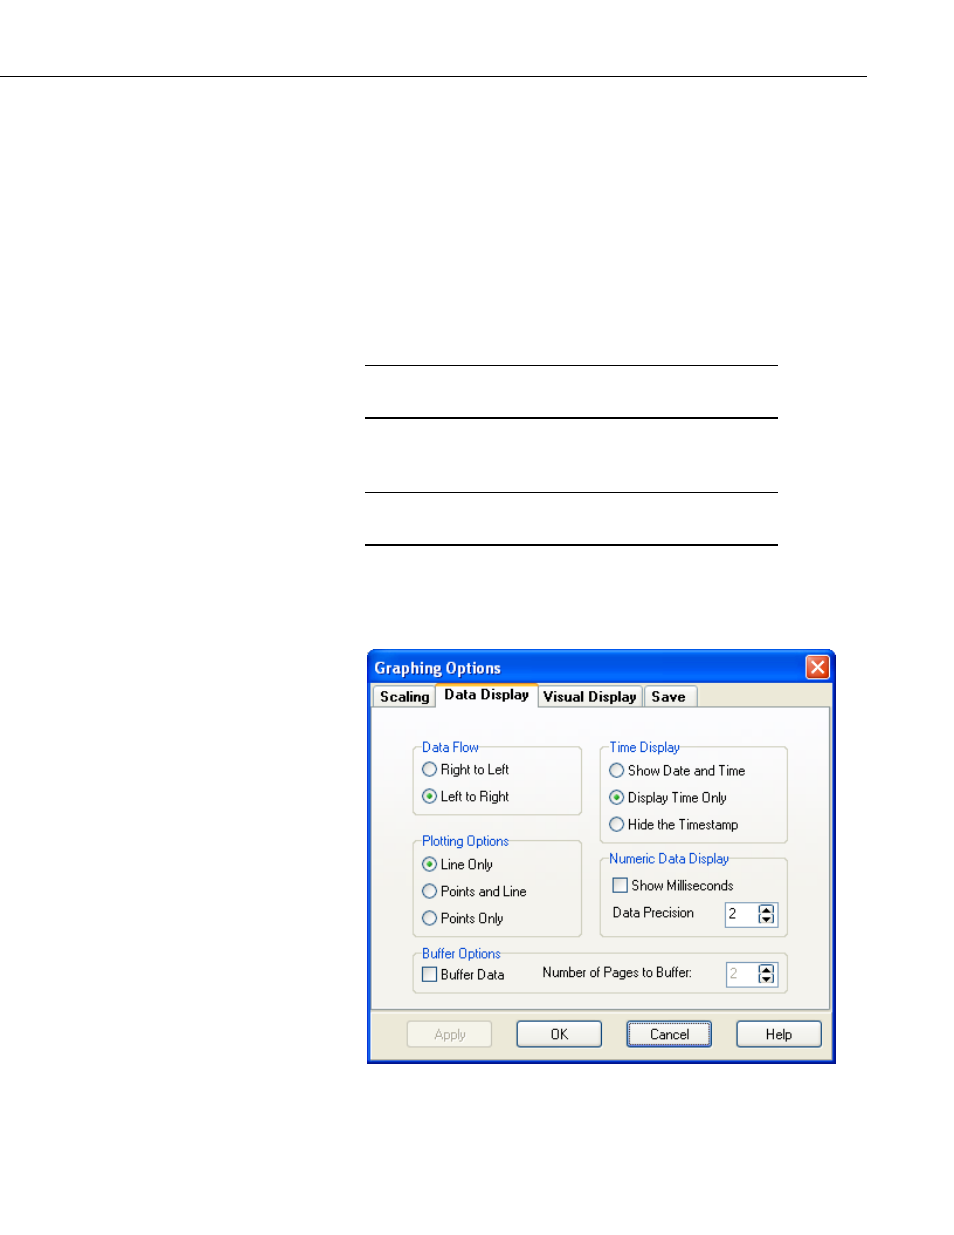
7.4.9.2 Data Display Options
Select the Data Display tab to adjust flow direction, plotting options, numeric
display, time, and buffering options.
The Data Flow section allows you to control whether the data on the graph
populates the screen from right to left or from left to right
NOTE
7-23