4 customizing the traces on the display, 1 individual trace options – Campbell Scientific RTDAQ Software User Manual
Page 178
Section 7. Monitoring Data in Real-time
7.4.9.4 Customizing the Traces on the Display
7.4.9.4.1 Individual Tr
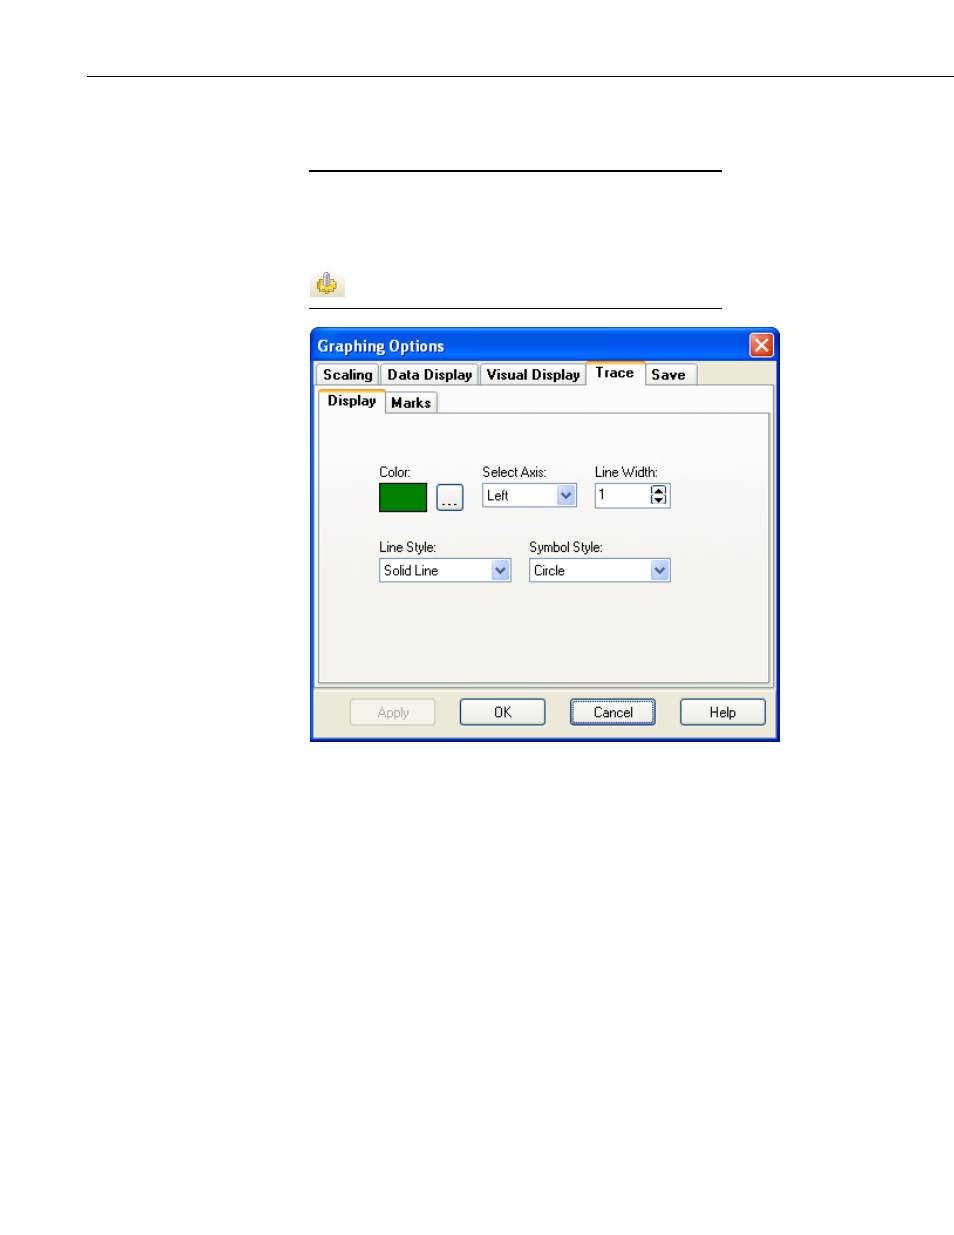
For the Trace tab to appear in the Graphing Options window,
ace Options
you must select an individual display field from the Selected
Fields section of the main graph screen before pressing the
Options button. You can also right-click on the individual field
and choose Trace Options or press the Trace Options button
.
In the Display tab of the Trace Options screen you can select the color to be
used
for displaying the points on the graph.
NOTE
used by the trace on the graph. Use the Select Axis drop-down to select
whether the point scaling of the trace should follow the left or right y-axis. Use
the Line Width setting to select the width of the line used to connect points
together (if you are connecting points with lines). Use the Line Style drop-
down to choose what kind of line will be drawn (dotted, dashed, solid, etc.).
You can also use the Symbol Style drop-down to choose a symbol to be
7-26