6 x-axis mode, 7 zooming in on the histogram – Campbell Scientific RTDAQ Software User Manual
Page 224
Section 7. Monitoring Data in Real-time
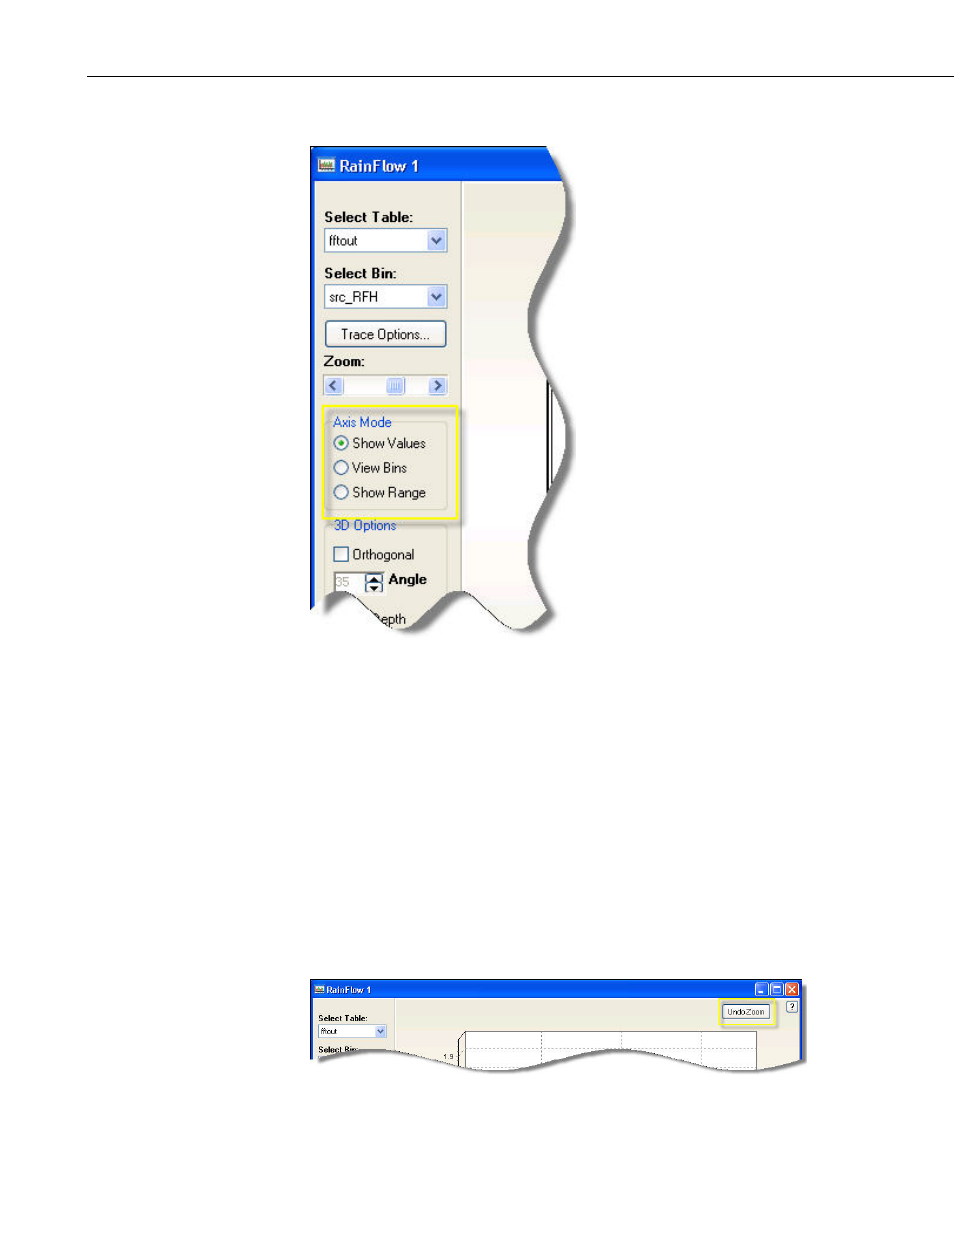
7.10.6 X-Axis Mode
The X-Axis Mode box allows you to set up how the amplitude bins of the
histogram will be represented on the display. Choose the Show Values option
to show the values for the Amplitude Bins. Only some of the locations along
the x-axis may have their values displayed, as space permits. Choose the View
Bins option to have the individual bins labeled with their unique order number.
If space does not permit, only some of the bin numbers will be shown. Choose
the Show Range option to show the left and right value boundaries for a
particular bin. Once again, only some of the bins may be labeled depending on
how much space is available.
7.10.7 Zooming in on the Histogram
You can zoom directly in to a particular location of the graph by clicking in the
display and drawing a box. When you release the mouse button, the area
within the box will become the full display area on the Rainflow display.
Press the Undo Zoom button in the top right corner of the graph to return to
the full scale display.
7-72