3 scrolling, 4 graph cursor – Campbell Scientific RTDAQ Software User Manual
Page 134
Section 6. View Pro
6.7.1.3 Scrolling
You can scroll through the graph by using the scroll bar at the bottom of the
graph window. Scrolling the graph will scroll the data on the data panel as
well. Conversely, scrolling through a data panel will also scroll the currently
selected graph.
Graph scrolling can be disabled by pressing the Lock Scrolling icon
on the
toolbar. The icon will change to
. Pressing the icon again will re-enable
scrolling.
When locked, the graph will not scroll. However, moving the scroll bar on
either the graph or the data file will still scroll the data file.
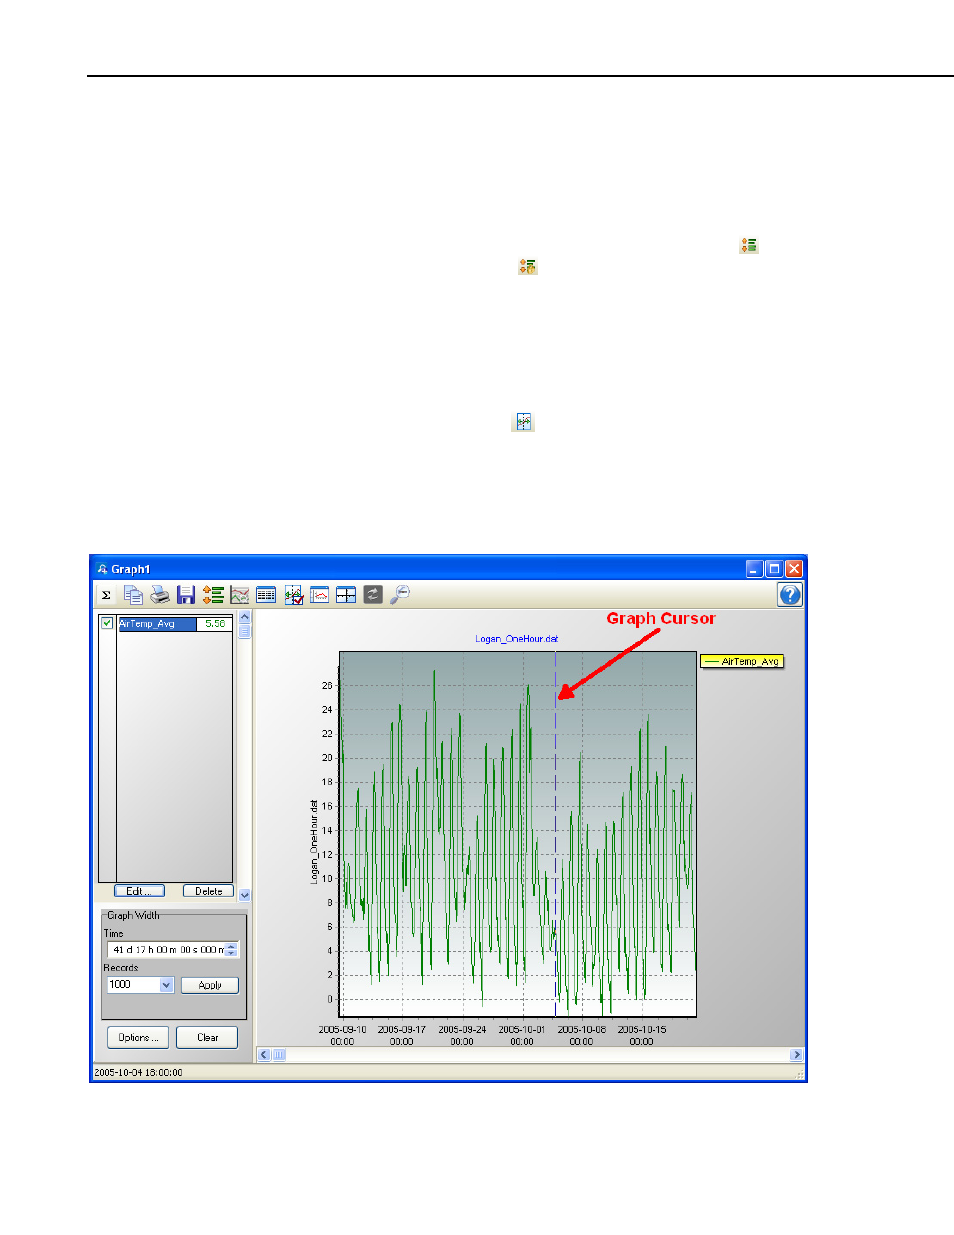
6.7.1.4 Graph Cursor
Pressing the Graph Cursor icon
on the toolbar will show the graph cursor.
As shown in the following figure, the graph cursor is a vertical line extending
from the top to the bottom of the graph display. When visible, you can click
and drag the cursor across the graph. Data values at the current cursor position
will be shown in the table to the right of the graph.
6-16