3 using the control buttons – Campbell Scientific RTDAQ Software User Manual
Page 188
Section 7. Monitoring Data in Real-time
7.6.3 Using the Control Buttons
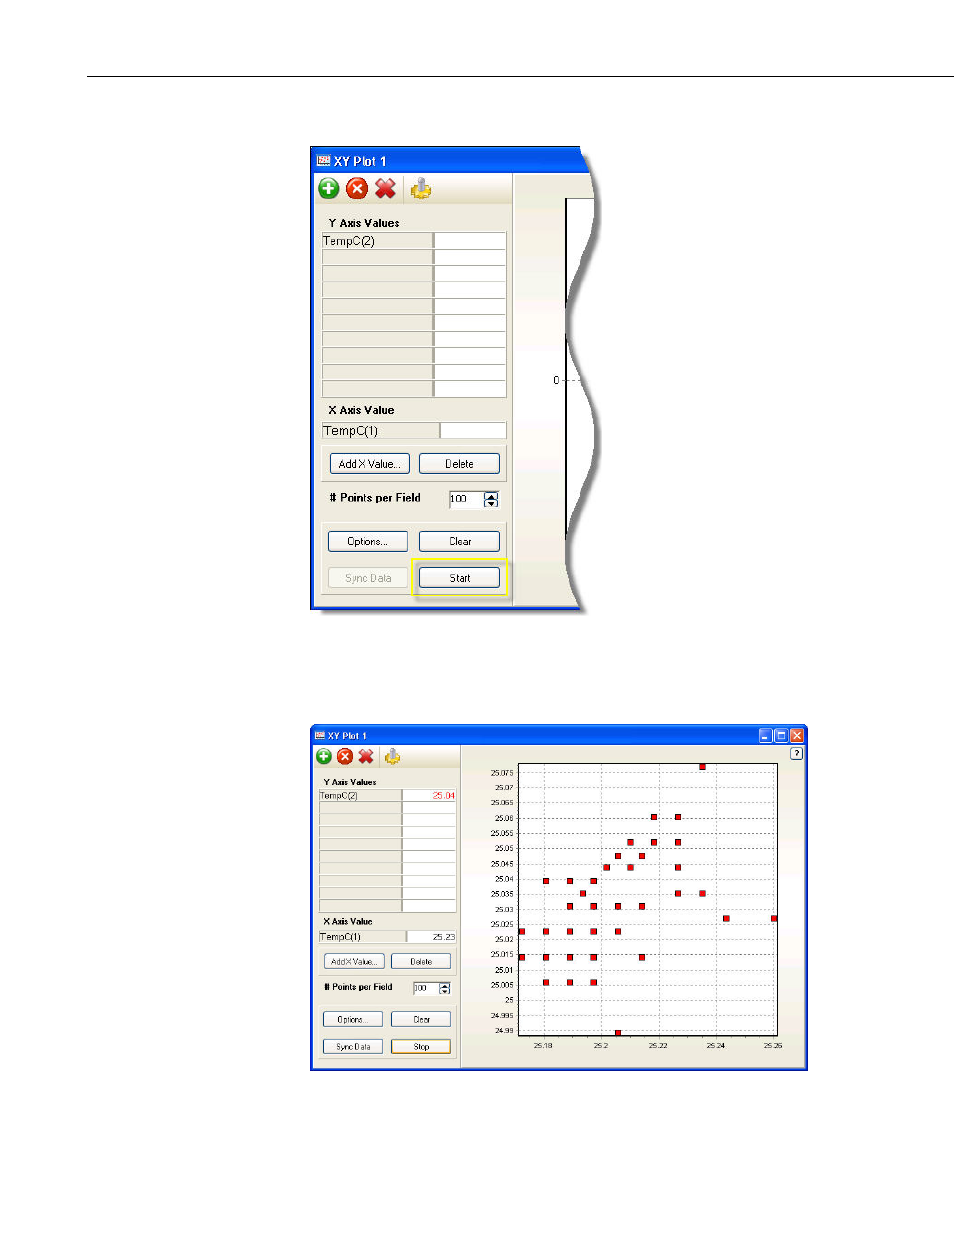
Once the proper y-axis and x-axis values have been selected, and the number of
points per field has been properly set, begin displaying the x-y plot points by
pressing the Start button. The points will begin displaying in the graphical
area of the screen.
7-36