8 setting the options for the fft/histogram screen, 1 scaling the axes – Campbell Scientific RTDAQ Software User Manual
Page 212
Section 7. Monitoring Data in Real-time
7.9.8 Setting the Options for the FFT/Histogram Screen
Set the options for the current FFT/Histogram screen by pressing the Options
button, or by selecting Options from a right-click menu. The Graphing
Options screen appears.
7.9.8.1 Scaling the Axes
an
w the graph.
ize the axis on the bottom of the screen.
g the
d
yed, or the user can specify what the maximum and minimum
e.
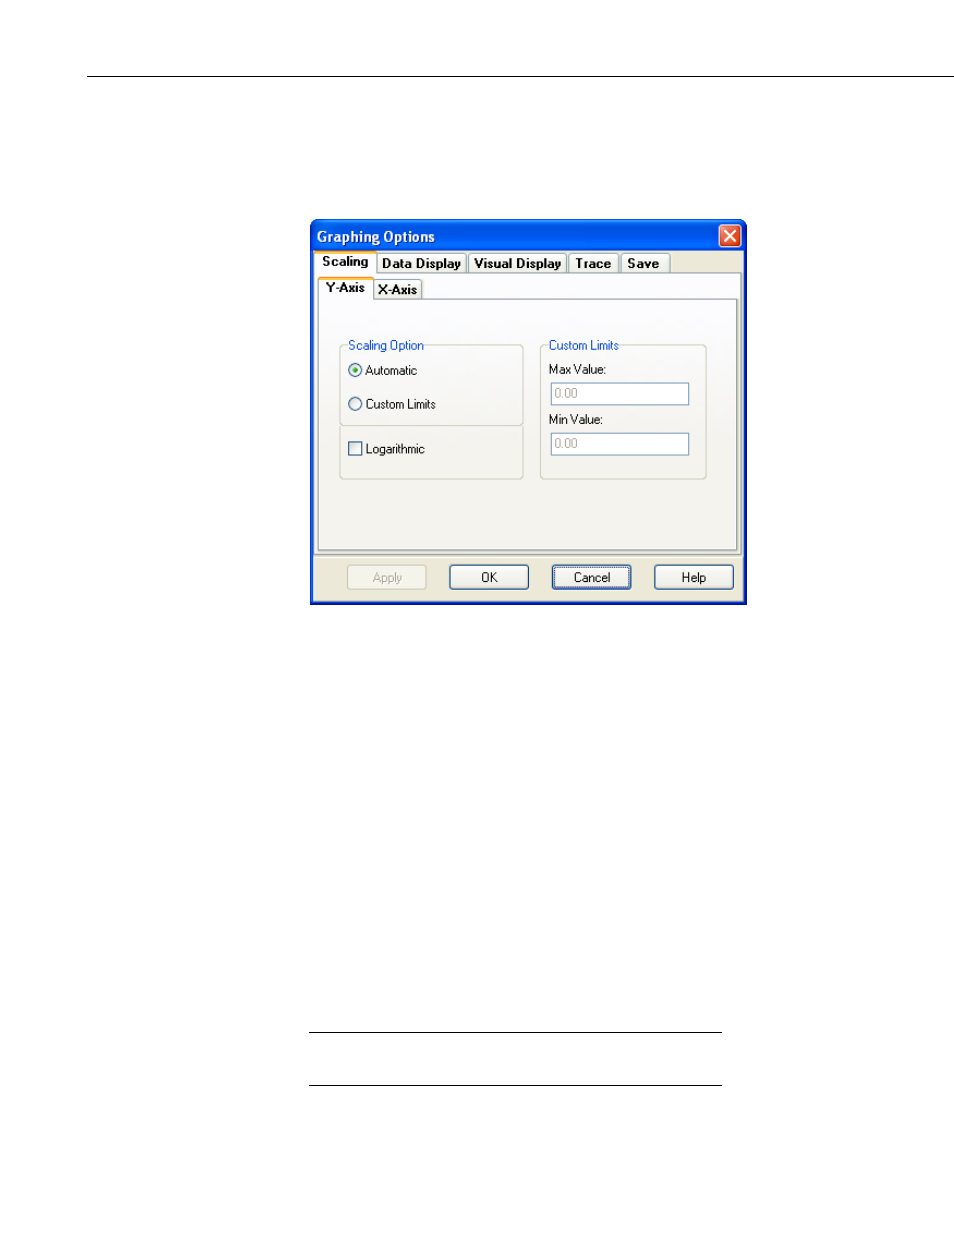
Choose the Automatic option to use a scale with the maximum and minimum
values on the scale to be automatically chosen each time the screen is drawn.
Set the values in the input boxes of the Custom Limits section to use a scale
with user-configurable maximum and minimum values. Choose the
Logarithmic check box to use a logarithmic scale for the current axis.
When using logarithmic scaling, the minimum value may not be
When data is displayed in the FFT/Histogram window, a scale is also
displayed showing various values for frequency levels on the screen. You c
control the y-axis scale on the left side of the graph. You can control the
frequency scales for the x-axis belo
Choose the Scaling tab from the Graphing Options screen to set up
parameters used to space data on the x and y axes of the display. Choose the
Y-Axis tab to customize the axis on the left side of the screen. Choose the
X-Axis tab to custom
The Scaling Options allow you to choose the method used for determinin
maximum and minimum values on the current axis, as well as whether to use
linear scaling (equal interval scaling) or logarithmic scaling. Maximum an
minimum values can be chosen automatically depending on the data set
currently displa
values should b
NOTE
zero or less than zero.
7-60