Campbell Scientific RTDAQ Software User Manual
Page 22
Section 1. Introduction
• The status of ports, flags, or any boolean variables can be monitored and
controlled within the Ports and Flags window.
• The Table Monitor allows quick numeric viewing of entire output tables.
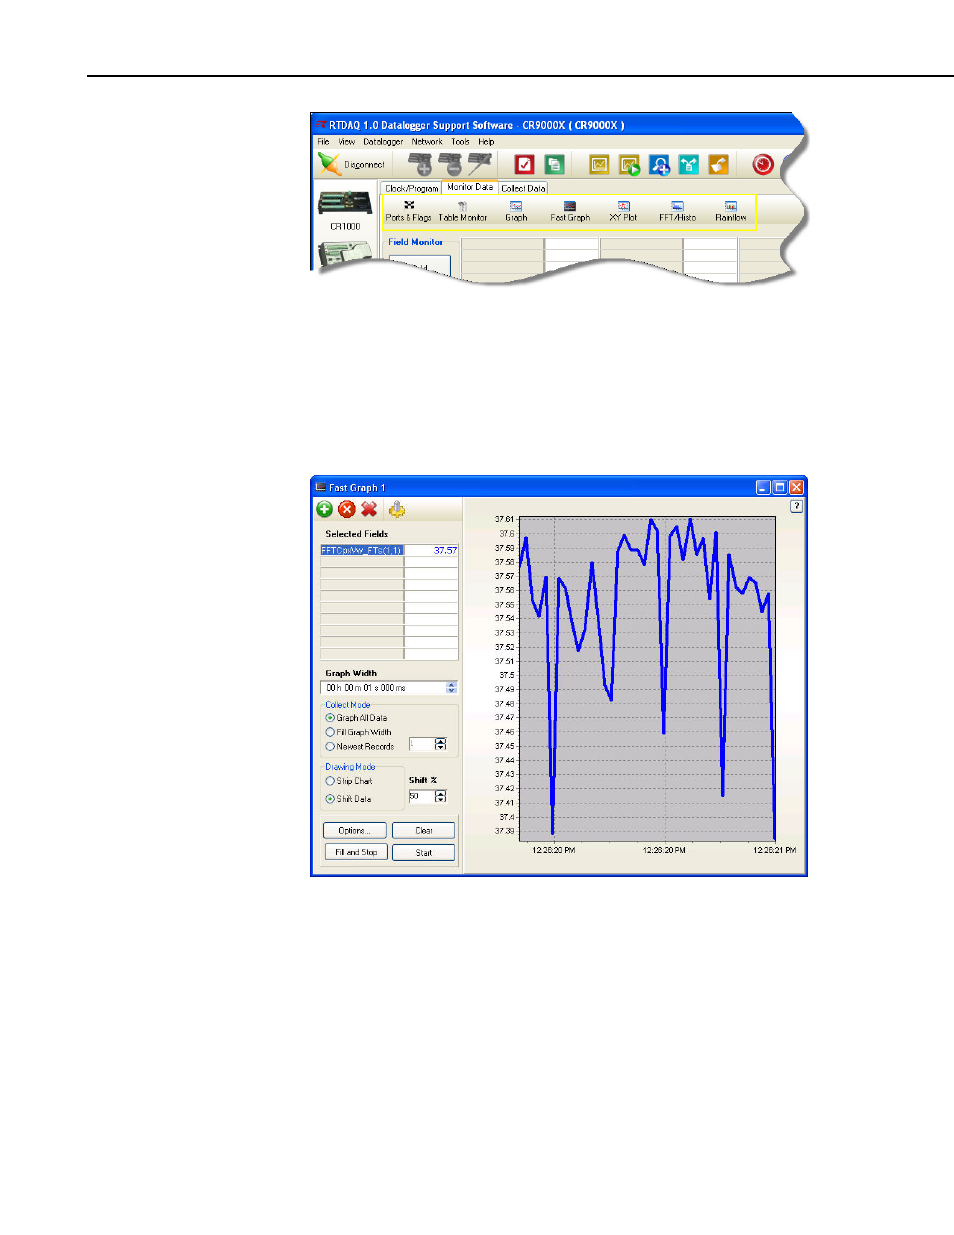
• With both the Graph and Fast Graph, graphical data traces from a
datalogger can be monitored in a window width as small as 1 millisecond,
with resolution support for individual points up to 100 KHz.
• The XY Plot allows up to four values to be plotted against another
measured value (other than the timestamp).
• With the Fast Fourier Transform viewer, both single-valued (amplitude
or power spectrum) and dual-valued (real-imaginary or amplitude-phase)
FFT spectra can be viewed.
1-4