3 using the buttons – Campbell Scientific RTDAQ Software User Manual
Page 206
Section 7. Monitoring Data in Real-time
7.9.3 Using the Buttons
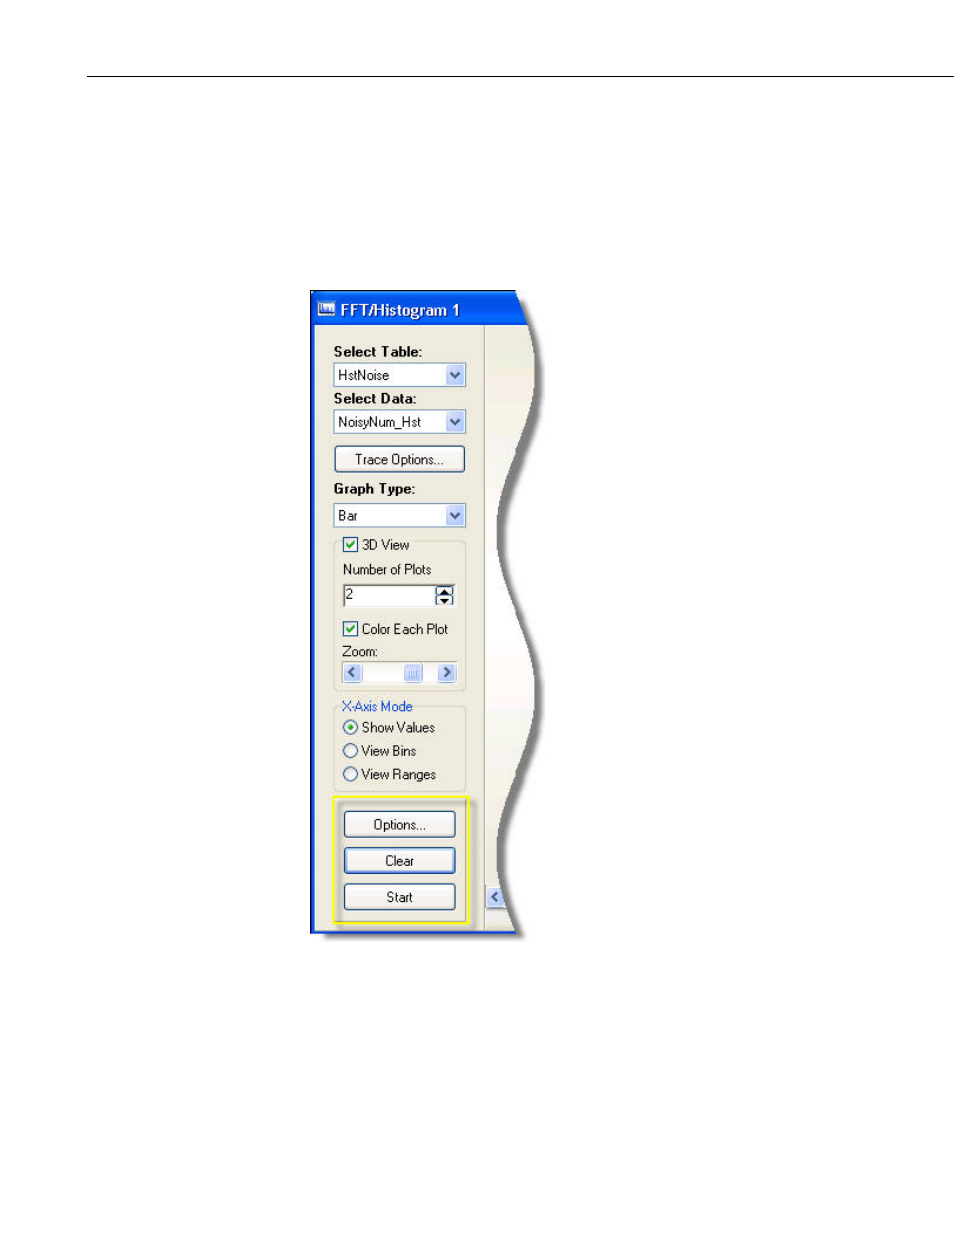
Press the Start button to begin graphing the spectra or histograms from the
datalogger. The FFT/Histogram screen displays data from the datalogger as
quickly as it can. Spectra or histograms will be displayed in the graphical are
of the FFT/Histogram screen. Press the Stop button to discontinue re
and graphing data. The FFT/Histogram window displays the Start button
when the window is stopped, and displays the Stop button in the same location
when the window is running.
a
trieving
Press the Clear button to remove the display of the current spectrum or
histogram, and begin displaying the next record. The display will not stop if it
Press the Options button to modify various display characteristics for the
graph. More detail about these settings are given below in the section entitled
Setting the Options for the FFT/Histogram Screen.
is in the “started” state, but just clear the screen and continue displaying new
data.
7-54