Controlling the data display, Change the meter style selection, Change the – HP Matrix Operating Environment Software User Manual
Page 67
2.
Any scenarios you have authorization to edit will be presented as links. Click the name of the
scenario you want to edit.
The Capacity Advisor - Edit Scenario screen will be displayed.
Controlling the data display
The default values for the data range and the
may not accurately represent
the interval of interest and the preferred metric. These are easily adjusted.
Change the meter style selection
Prerequisites:
•
You must be editing a scenario (see
“Editing a scenario” (page 66)
).
•
Click the Absolute or Percent radio button.
The meter bars in the scenario resource utilization table display the data as absolute numbers
or as percentages, according to your selection.
Change the data collection period by setting the data range
Set the interval within a data collection period that you want to use as the foundation for a simulation
or to view a specific historic period.
Prerequisites:
•
You must be editing a scenario (see
“Editing a scenario” (page 66)
NOTE:
Changes to the data collection period persist across sessions.
1.
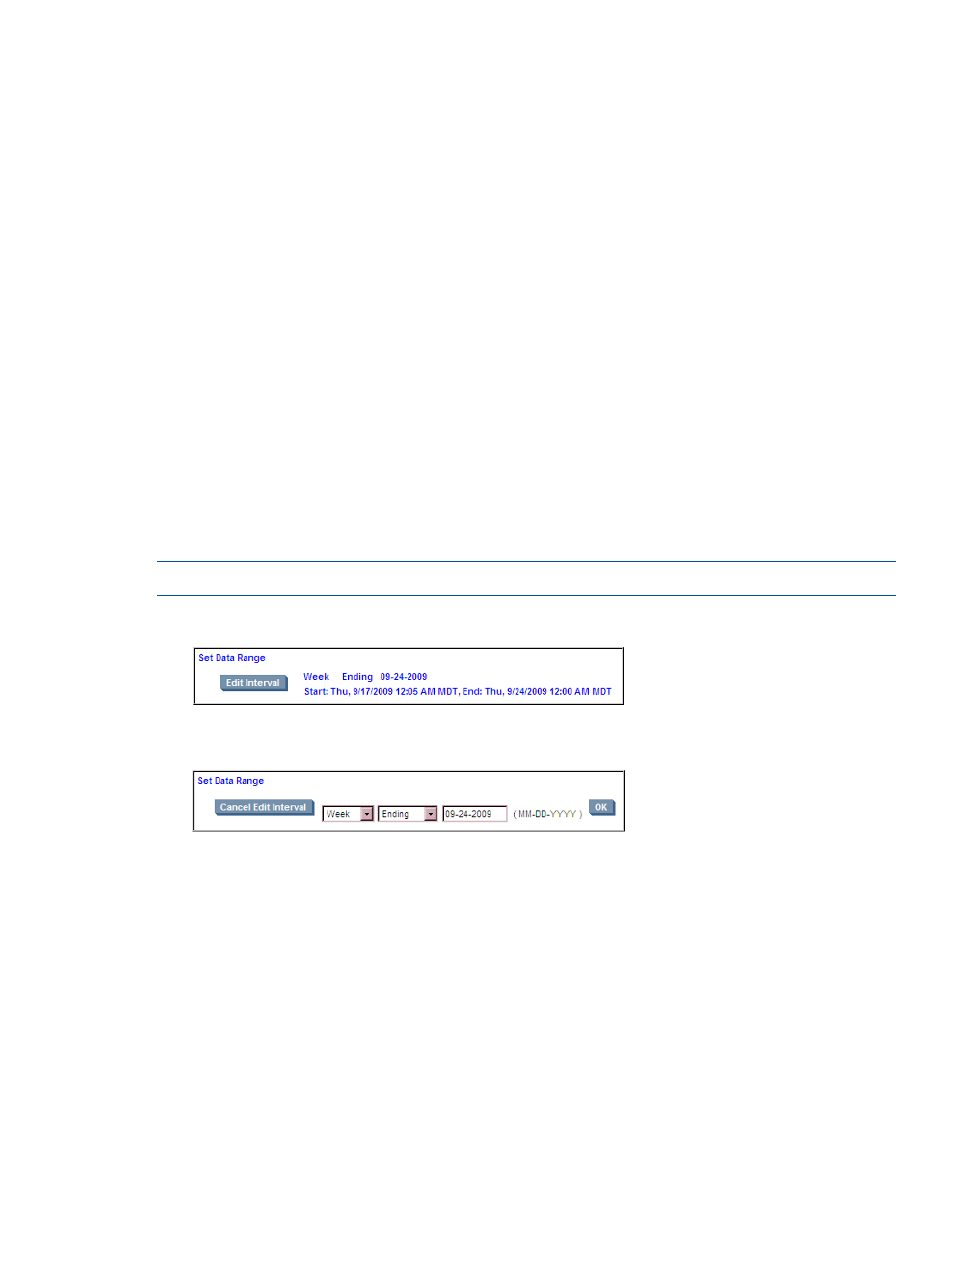
Click Edit Interval within the Set Data Range box.
The fields are enabled as shown in the following image.
2.
Click the first drop-down arrow to the left to see the choices for the duration of the data
collection period that you want to use.
Choose one to view in the display. The choices are as follow:
•
Day
•
Week (default)
•
Month
•
Quarter
•
Half
•
Year
3.
Click the next drop-down arrow to the right to see the choices for selecting what relationship
the interval shall have to the selected date.
Choose one to view in the display. The choices are as follow:
Working with scenarios
67