Viewer, Caution – ROTRONIC LOG-HC2 Universal Datalogger User Manual
Page 47
47
V
iewer
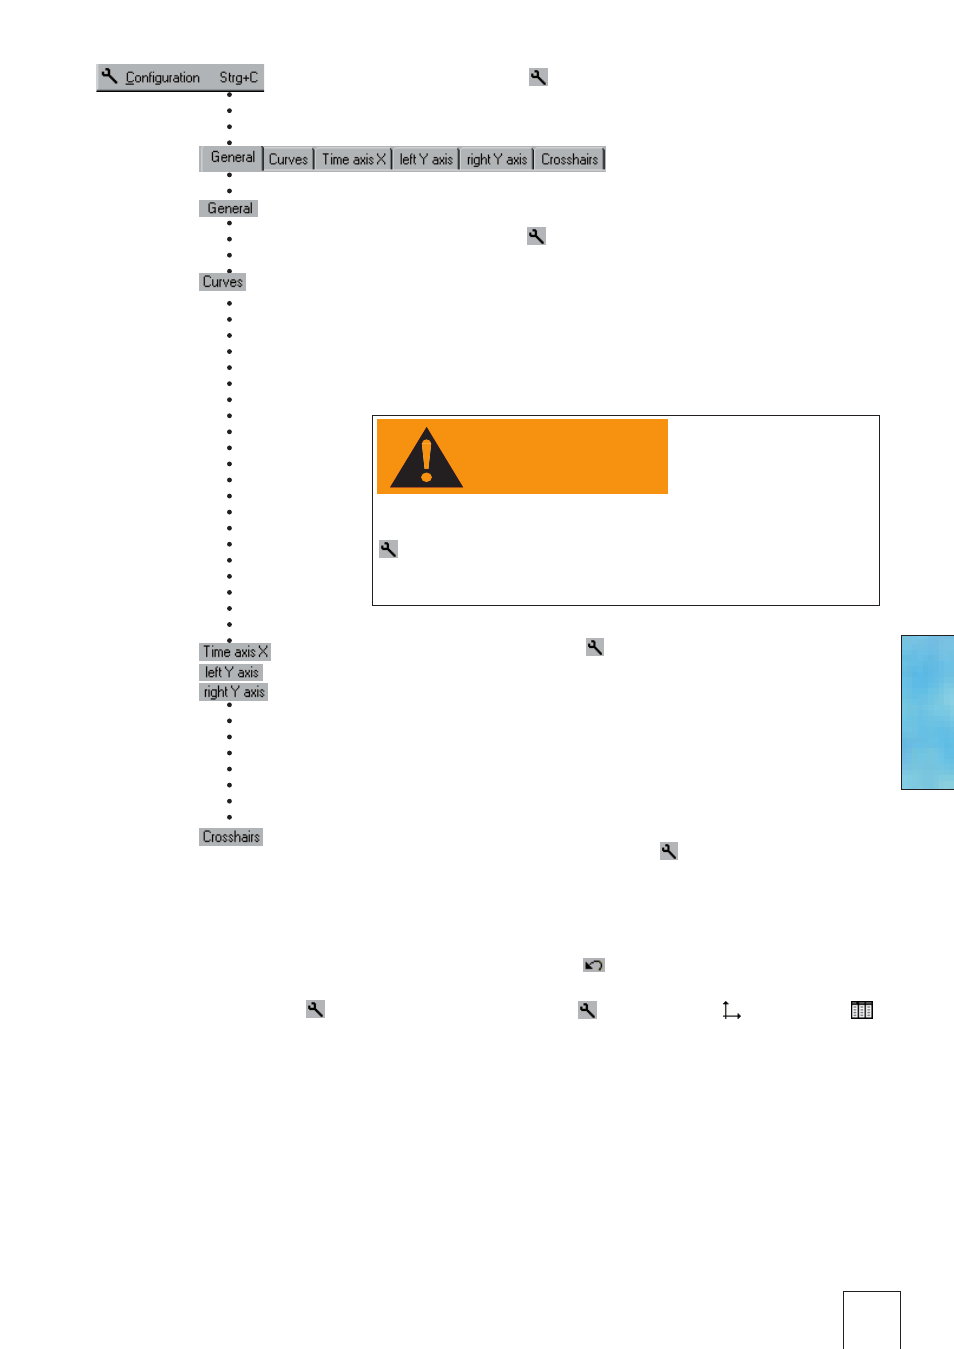
Using
Configuration >Time axis X, the time axis
can be annotated, the time segment to be displayed
can be set, and the Increment for the lettering and
ruled lines, together with the
Format for numbers
can be entered .
Automatic axis annotation with an
Increment of 0
(zero) .
The number
Format for the displayed X and Y values
is entered via
Configuration > Crosshairs .
The displayed Y value always relates to the left axis .
As long as
Configuration is not quitted, users can
undo the last changes made to the displayed con-
figuration screen with .
Quit
Configuration via Graph or Table .
Upon quitting, the
Viewer saves the configuration .
Undo the last changes
Quit
Configuration
Configuration allows the display method of the
measurement parameters to be set with the help of
the configuration screens .
Entering title and footer information is achieved via
Configuration > General .
The associated sensor name, assignment to the left
or right axis, the colour, line weight and style can be
set for each curve .
Axis > inactive allows the graph curve to be shown
or hidden as required .
CAUTION
Depiction of the curves using dots (
Configuration
>
Curves > Dot: Yes) requires more computing
power, possibly leading to problems .