Viewer – ROTRONIC LOG-HC2 Universal Datalogger User Manual
Page 45
45
V
iewer
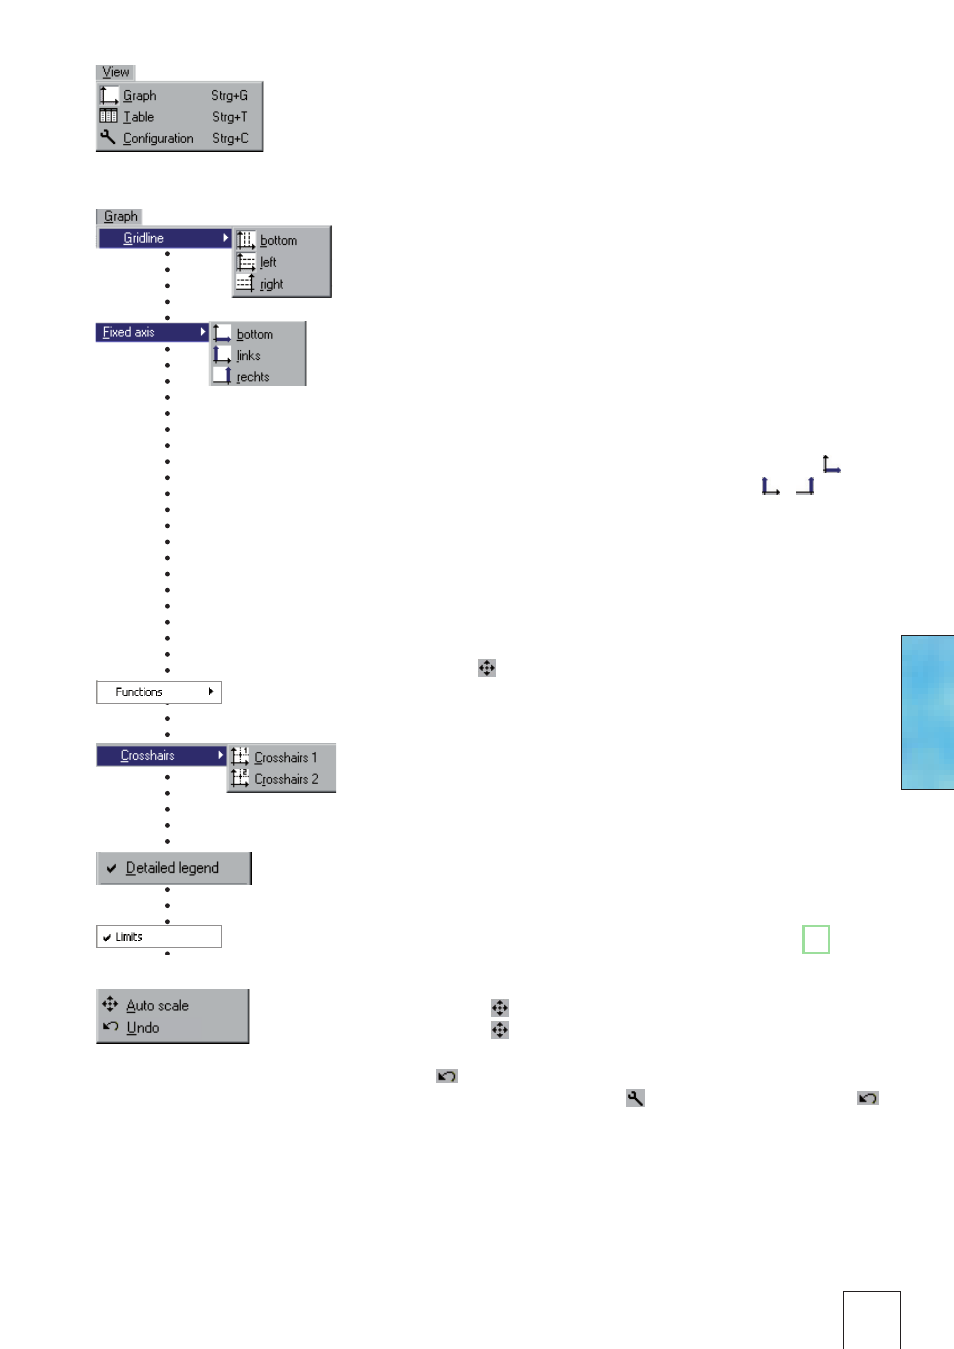
View, Graph ,Table, Configuration
Graph
Gridlines can be shown for each axis (bottom, left,
right) .
Fixed axis simplifies the amount of detail shown
within a time window or range of values .
• Select the required section with the left mouse but-
ton held down . The section is displayed enlarged .
• For closer viewing, lock the time window ( ) or
range of values to the left or right axis ( / ) . Sev-
eral axes can be locked .
• With the left mouse button held down, select the
required detail . The enlargement is displayed with-
out altering the time segment or range of values of
the locked axes .
A further click releases the lock .
Auto scal clears all locked axes .
Calculation functions
Using the two
Crosshairs values can be measured
on the X and Y traces . X and Y differences can be
evaluated with the second cross-hair . The Y values
displayed are always associated with the left axis .
With
Detailed legend traces can be turned on and
off in the list of sensors .
If available: Display of the alarm limits (see ->42) .
The complete record is displayed by selecting
Auto scale .
Auto scale clears all locked axes .
Undo undoes the last enlargement . As long as
the
Configuration dialog is not quitted, Undo
allows the last changes made to the displayed con-
figuration screen to be undone .