Multichannel Systems Roboocyte2 Manual User Manual
Page 96
Roboocyte2 Manual
92
In order to have a closer look at the recordings in the “Data List”, click on the triangle icon
"Expand / Collapse All"
left to the well entry. In this example, seven recordings have been
performed to generate a dose-response curve for the P2X2 receptor that is an ATP-gated,
on-selective cation channel. To expand all well entries simultaneously, click on the icon
"Select / Deselect All"
to select and display all recordings in the plate. Another click
on the respective icon works in the opposite direction.
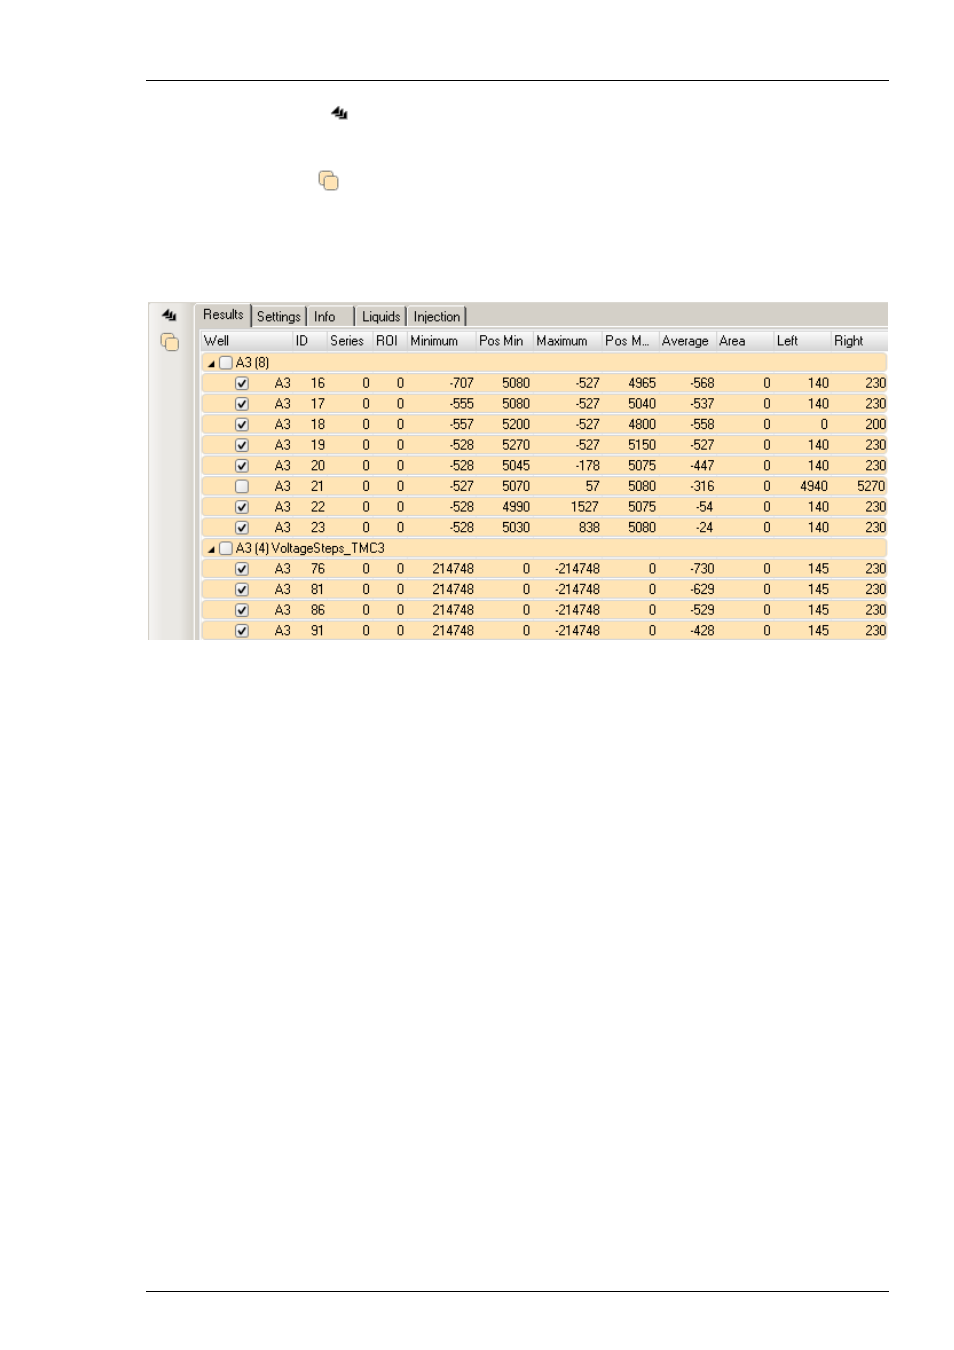
Data List: "Results" tabbed Page
The "Results" tab includes the following information, from left to right:
Well: The well number for the recording (B12).
ID: The recording ID (from 30 to 36).
Series: The series number; if no series has been assigned in the recording script, series value
is zero.
ROI: The ROI (Region of Interest) number.
Minimum: The minimum current within the ROI.
Pos Min: The position (time) within the ROI where the minimum was detected (in ms, s, or min).
Maximum: The maximum current within the ROI.
Pos Max: The position (time) within the ROI where the maximum was detected (in ms, s, or min).
Average: The average current within the ROI.
Area: The calculated area (charge) within the ROI in nA*s. The area is calculated from absolute
current; please note that this calculation gives meaningful values only after subtracting the
baseline.
Left: Position of the left ROI cursor.
Right: Position of the right ROI cursor.