Multichannel Systems Roboocyte2 Manual User Manual
Page 110
Roboocyte2 Manual
106
Display Tools
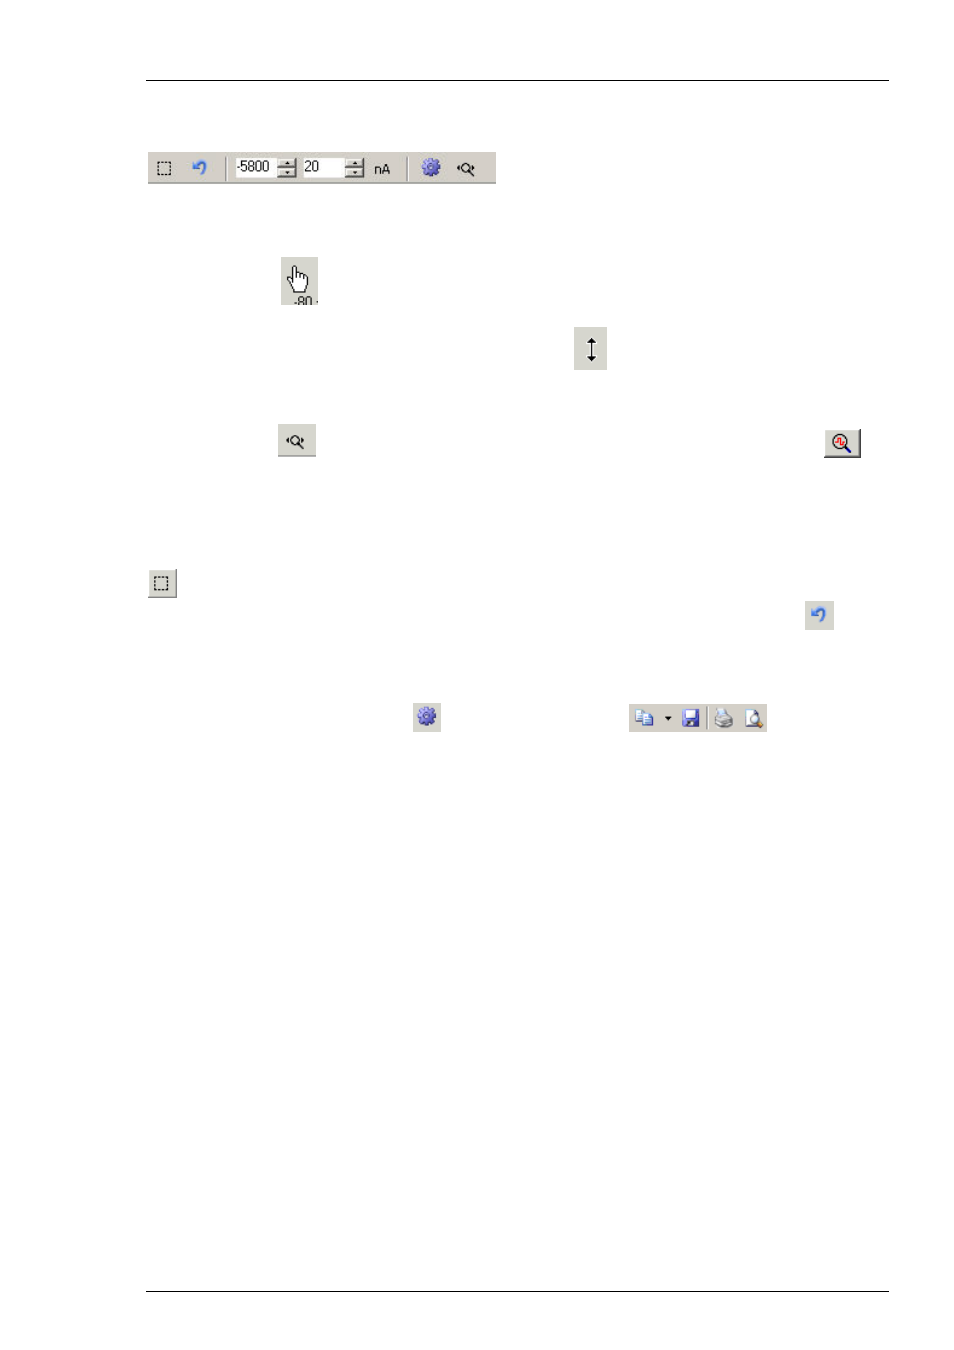
Scaling the Axes
Similar as with the displays in the Roboocyte2 program, you can scale and zoom the “Data
Display” window with the buttons located below the display Likewise, you can use the mouse
to move or scale axes. Move the mouse pointer above the respective axis - the pointer will now
appear as a hand
. Hold down the left mouse button to grab and move the axis. When you
hold at the same time the control key (keyboard), the mouse pointer will change to an arrow and
moving the mouse (or mouse wheel) will rescale the axis
.
Automatic Scaling
Clicking this icon
rescales the x-axis to the whole time range and clicking this button
,
automatically scales the y-axis to display the whole current range. In addition to the trace, all
cursors (drift cursors in green, baseline cursors in blue, and ROI cursors in red) will be displayed
at positions which have been defined in the corresponding recording script.
Zooming and Rezooming
When you press this button the mouse pointer will change its appearance and you can specify
a rectangular region in the data display to which you can zoom Use the "Reset" button
to get
back to the original view.
Exporting or Printing of the Display
When you click on the “Print” icon
, additional icons appear
, which allow
you to save or print out the display. You can (from left to right) copy the display figure to the
clipboard, save the display in all kind of formats (jpeg, tiff, png etc), print the display or have
a preview before using these functions.