Luminex xPONENT 4.2 for FLEXMAP User Manual
Page 78
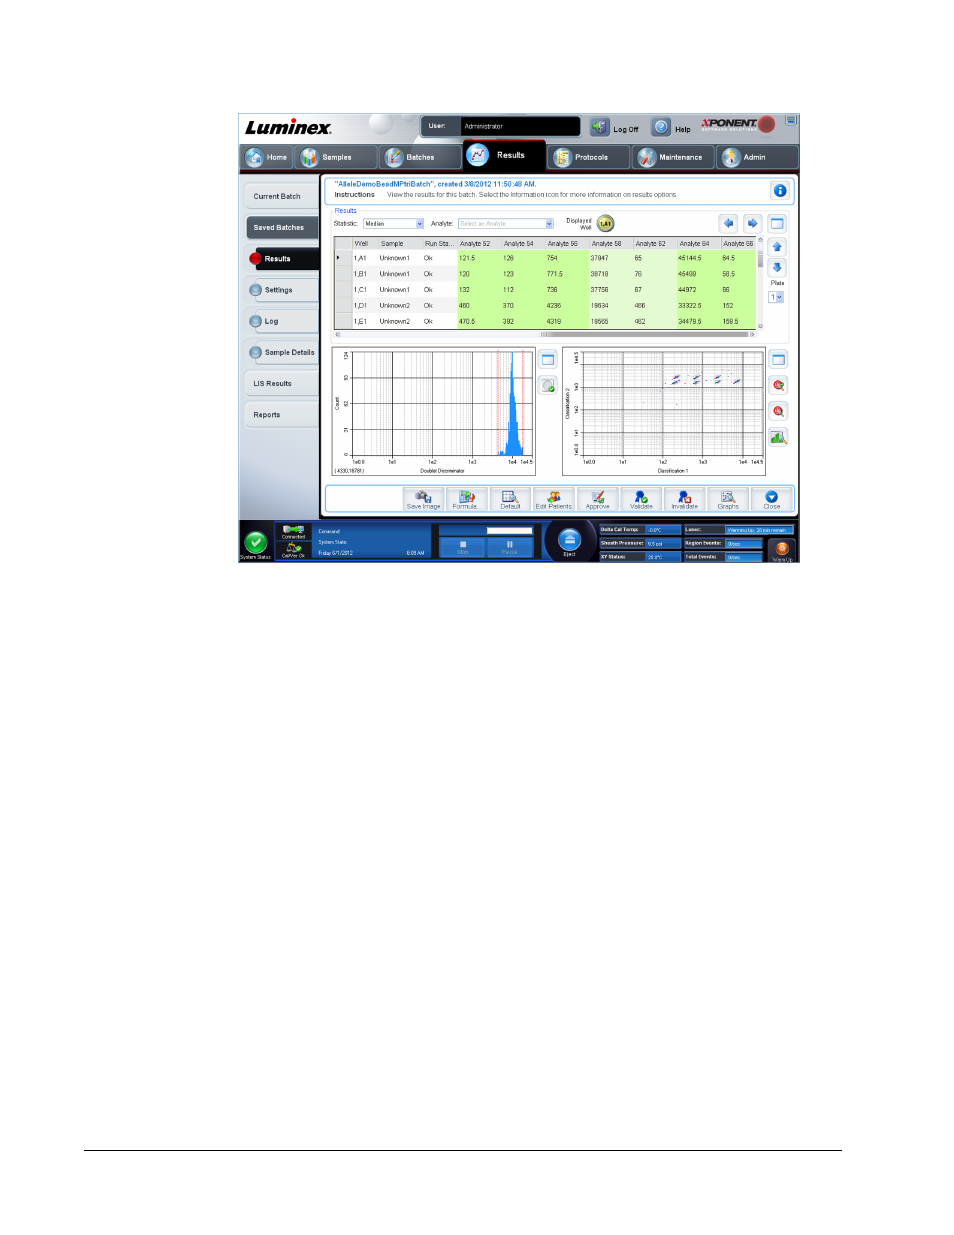
This subtab displays the following features:
There are three maximize buttons in this window, one for each major pane. Click the
appropriate one to maximize the pane. After clicking, the clicked button becomes a minimize
button. Click minimize to return the pane to its standard size.
This tab has the following features:
• Statistic - To view a particular statistic for analytes in a batch.
NOTE: The statistics displayed change according to the analysis type
selected.
• Median (MFI) - The value (detected signal) that is in the middle of the microsphere
population when sorted by reporter value lowest to highest. The median value is much
less sensitive than the mean value to outliers and carryover.
• Test Result - The calculated analysis value for quantitative or qualitative assays derived
from standards with known values.
• Count - Gated events, if gates are set.
• Net MFI (Median Background) - Net MFI median Background.
• % CV of microspheres - The measure of relative dispersion within the distribution.
%CV = 100 x Std Dev / Mean
• Standard Deviation - For calculating sample variability or dispersion, Luminex uses the
standard deviation formula.
• Peak - The value that is equal to the largest number of data points within the distribution.
For example, in data set {1,2,2,3,3,3,4,5}, 3 is the peak because it occurs the most
frequently in the distribution list.
• Trimmed Count
xPONENT
®
for FLEXMAP 3D
®
64