Luminex IS Version 2.3 (IVD) User Manual
Page 37
x
MAP Technology
Luminex 2.3 Software
PN 89-00002-00-254 Rev. B
27
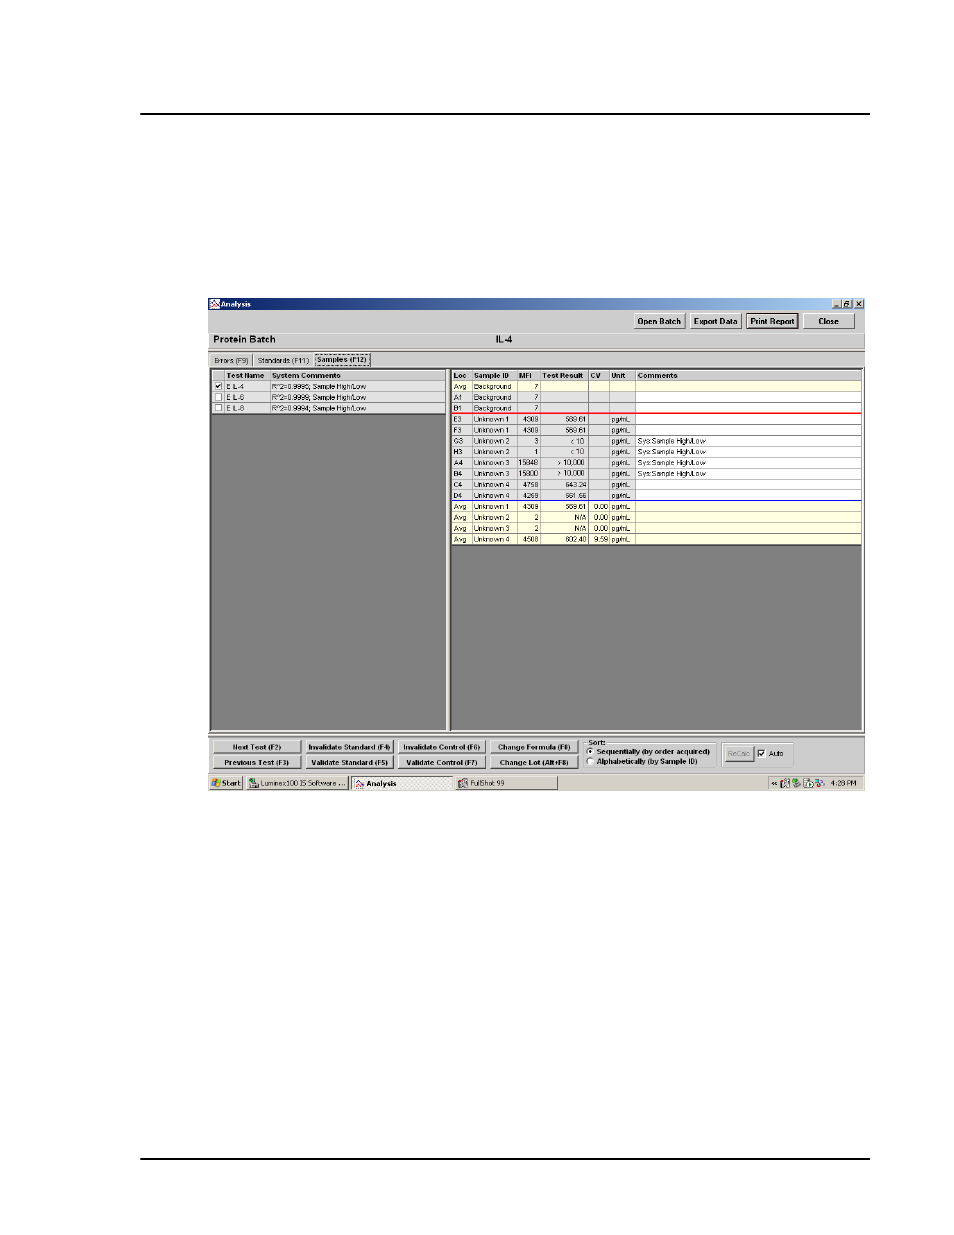
The system does not flag results as normal or abnormal according to
a defined range. Error flags only note samples that fall below or
above the standard curve.
The Comments column cells are editable and the information is
displayed in reports.
Figure 20 Analysis Window - Samples Tab Open
Replicate
Averaging
Standard and control replicates are predefined in the template. You
define unknown sample replicates in batch setup indicated by
replicate Sample ID.
The data analysis function supports replicate sampling. It calculates
each sample as an individual sample, which is then averaged to
obtain a replicate average.
• Standards tab—displays standard and control average values.
• Samples tab—displays sample average values.
Replicate averages are displayed with AVG in the Loc (location)
column.