Luminex IS Version 2.3 (IVD) User Manual
Page 25
x
MAP Technology
Luminex 2.3 Software
PN 89-00002-00-254 Rev. B
15
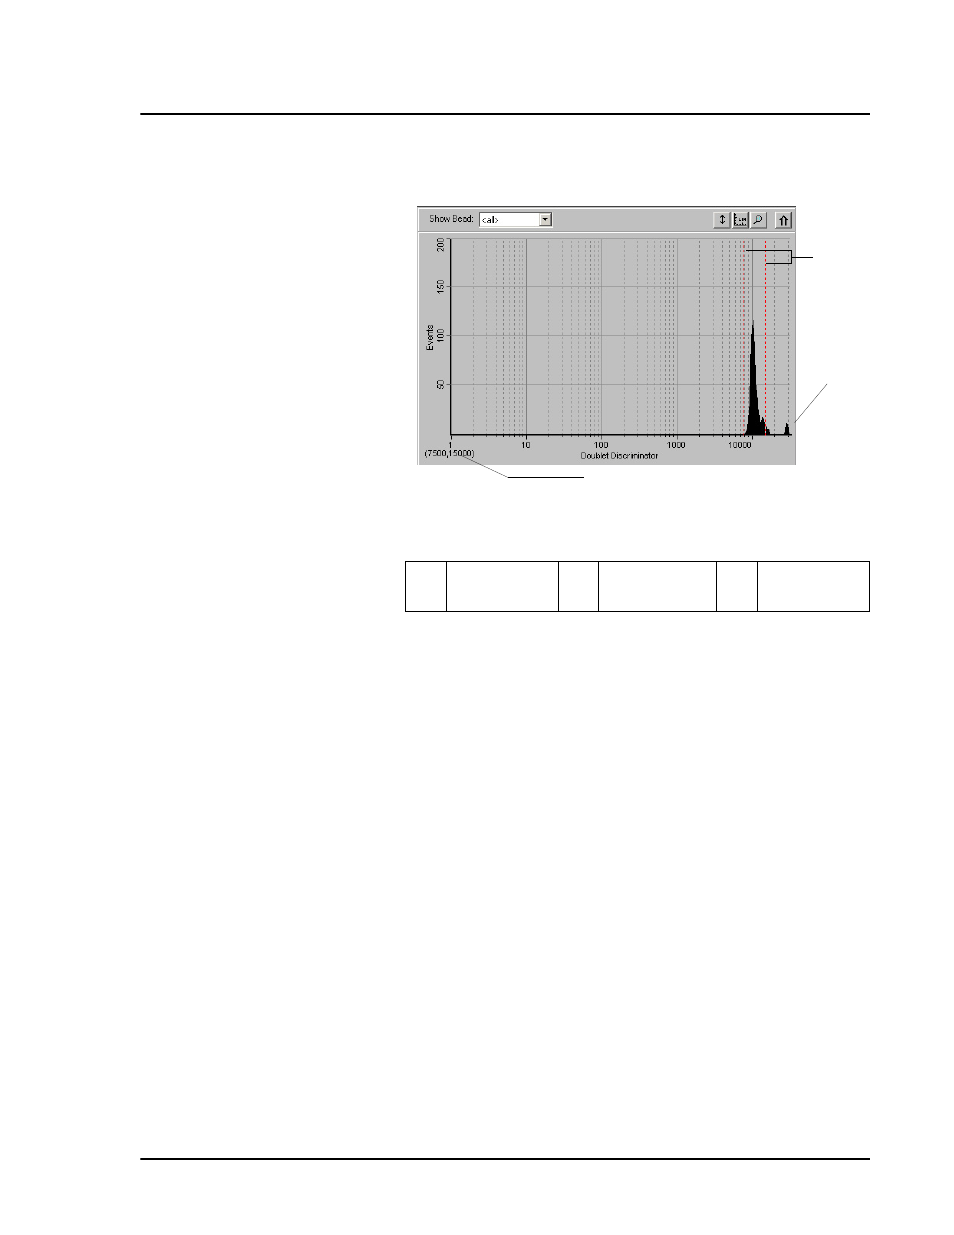
Figure 13 Set DD Gate Example
The Histogram contains the Show Bead menu and four buttons:
• Autoscale
• Zoom
• Log/Linear
• Maximize
For more information on these commands, see the Commands
section beginning on page 29.
The Dot Plot (or bead map) appears in the lower-right section of the
Acquisition Detail tab. See Figure 14. The dot plot shows a graphical
display of real-time data collection.
Luminex recommends using the default settings to collect data. The
default axes are Classification 1 on the X axis and Classification 2 on
the Y axis. To see the dot plot, you must use the default axis. To
display the bead set information, hover the mouse pointer over the
desired region. You can change the X axis and Y axis of the dot plot
for troubleshooting purposes, although you should use the default
settings in all other scenarios.
1
Gate
Boundaries
2
Aggregate
Beads
3
Numerical
Gate Position
1
2
3