3 dashboard (web rcs) – Analog Way SmartMatriX Ultra User Manual
Page 77
77
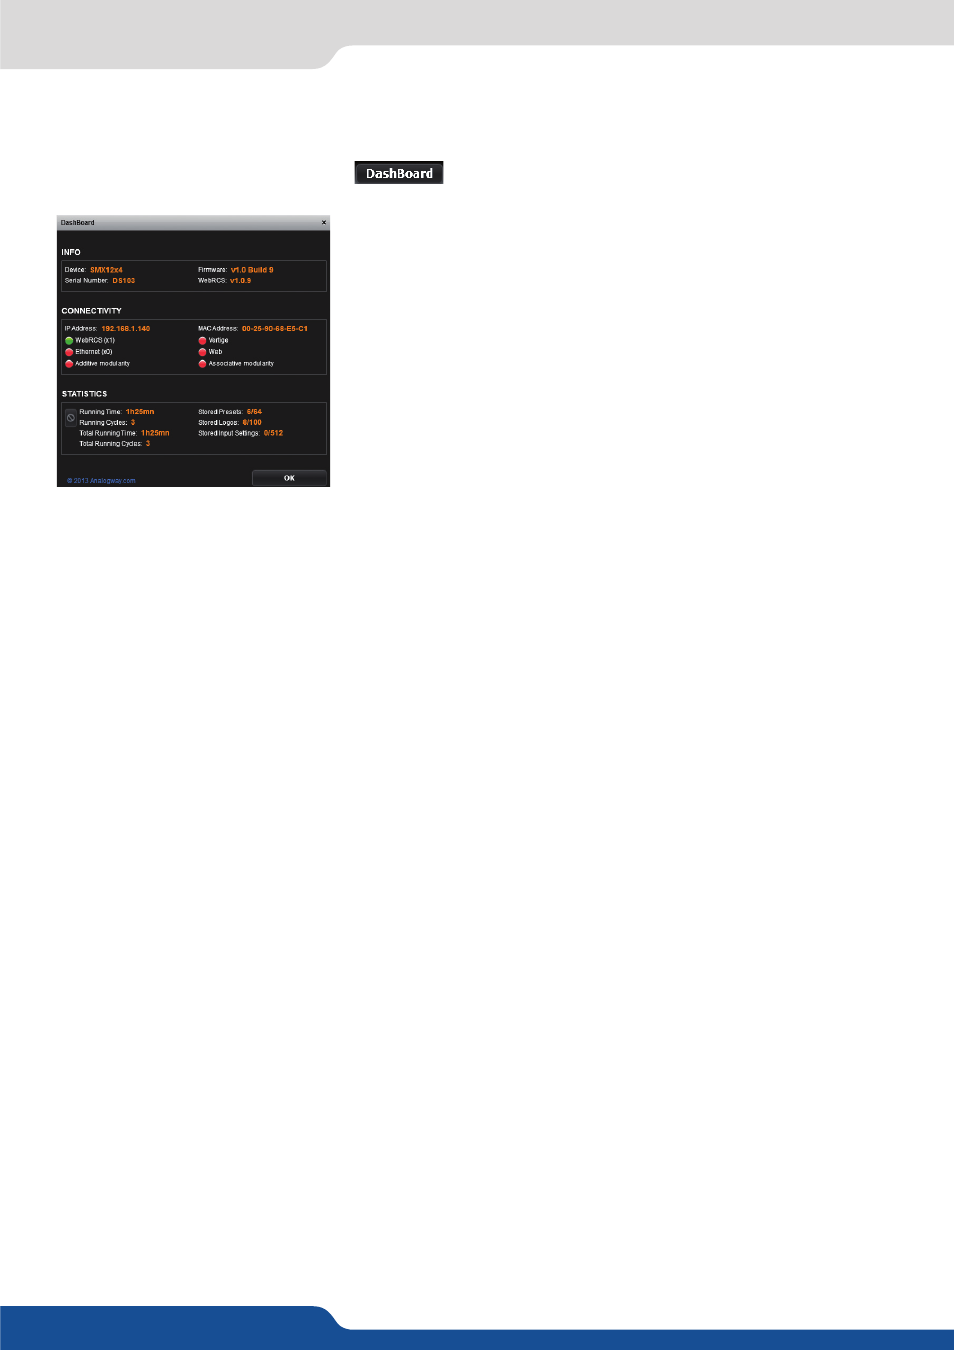
11.3 Dashboard (Web RCS)
On the Web RCS, you have access to a chart with global information on the unit.
Please click on the Dashboard button:
On this chart, you will find under the INFO tab, the Device name, the
Serial number of your product, the actual firmware and the software
version of the Web RCS.
Under CONNECTIVITY, you will find the current IP address of your unit
and its MAC address.
Then you find an some
RED
/
GREEN
alarm which give you information
about the unit connectivity.
If it is
GREEN
:
Ethernet: your unit is connected to your internet network
Web RCS: your unit is connected to a Web RCS, it gives you the number of connections
Link: your unit recognize other SmartMatriX Ultra unit on the network..
Web: your unit is actually connected to the web (web update is available)
Vertige: a Vertige™ remote controller is detected.
Sync: Synchronization is established with a controller.
If it is
RED
:
Your unit is not connected to the specific field.
Under STATISTICS, you can overview your SmartMatriX Ultra use information. Find the running time since
the last boot, or the total running time since you bought the unit. Running Cycles, stored presets number,
stored Logos number and stored input settings information are also available.
11.3 Dashboard (Web RCS)