Ocean Optics Curie UV-VIS Emission User Manual
Page 49
B: Calibrating the Wavelength of the Curie Spectrometer
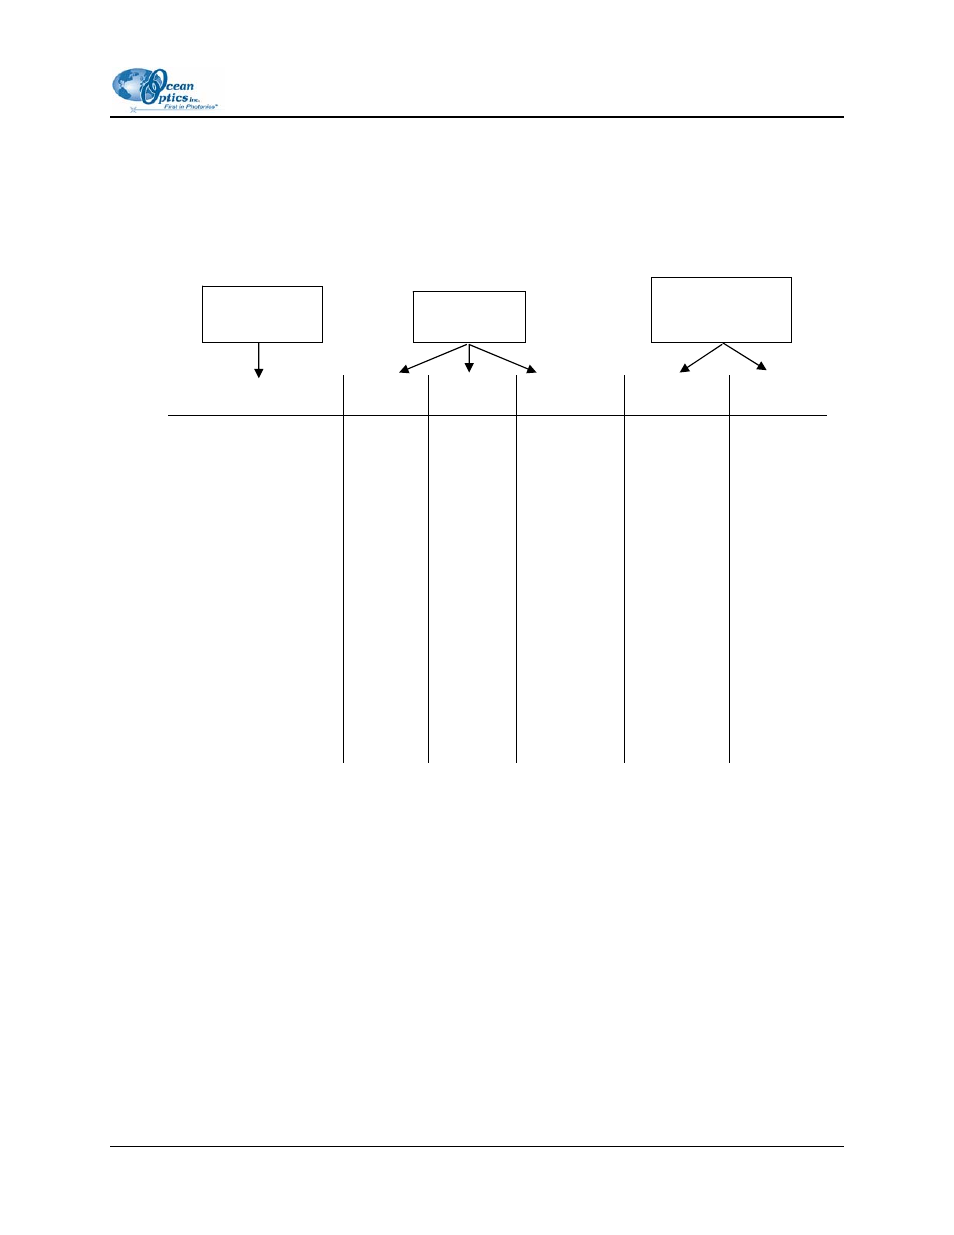
5. Use the spreadsheet program or calculator to create a table like the one shown in the following
figure. In the first column, place the exact or true wavelength of the spectral lines that you used.
In the second column of this worksheet, place the observed pixel number.
In the third column, calculate the pixel number squared.
In the fourth column, calculate the pixel number cubed.
Values Computed
from the Regression
Output
43
True Wavelength
(nm)
Pixel #
Pixel #
2
Pixel
#
3
Predicted
Wavelength
Difference
Dependent
Variables
Independent
Variable
253.65
296.73
302.15
313.16
334.15
365.02
404.66
407.78
435.84
546.07
576.96
579.07
696.54
706.72
727.29
738.40
751.47
175
296
312
342
402
490
604
613
694
1022
1116
1122
1491
1523
1590
1627
1669
30625
87616
97344
116964
161604
240100
364816
375769
481636
1044484
1245456
1258884
2223081
2319529
2528100
2647129
2785561
5359375
25934336
30371328
40001688
64964808
117649000
220348864
230346397
334255384
1067462648
1389928896
1412467848
3314613771
3532642667
4019679000
4306878883
4649101309
253.56
296.72
302.40
313.02
334.19
365.05
404.67
407.78
435.65
546.13
577.05
579.01
696.70
706.62
727.24
738.53
751.27
0.09
0.01
-0.25
0.13
-0.05
-0.04
-0.01
0.00
0.19
-0.06
-0.09
0.06
-0.15
0.10
0.06
-0.13
0.19
6. Use the spreadsheet or a calculator to calculate the wavelength calibration coefficients. In the
spreadsheet program, find the functions to perform linear regressions.
• If using Quattro Pro, look under Tools | Advanced Math
• If using Excel, look under Analysis ToolPak
640-11100-000-02-0406