Drying time table – Grain Systems PNEG-1915 User Manual
Page 87
1. Drying Time Table
PNEG-1915 VN2 Portable Dryer Drying Charts for All Models of Vision
87
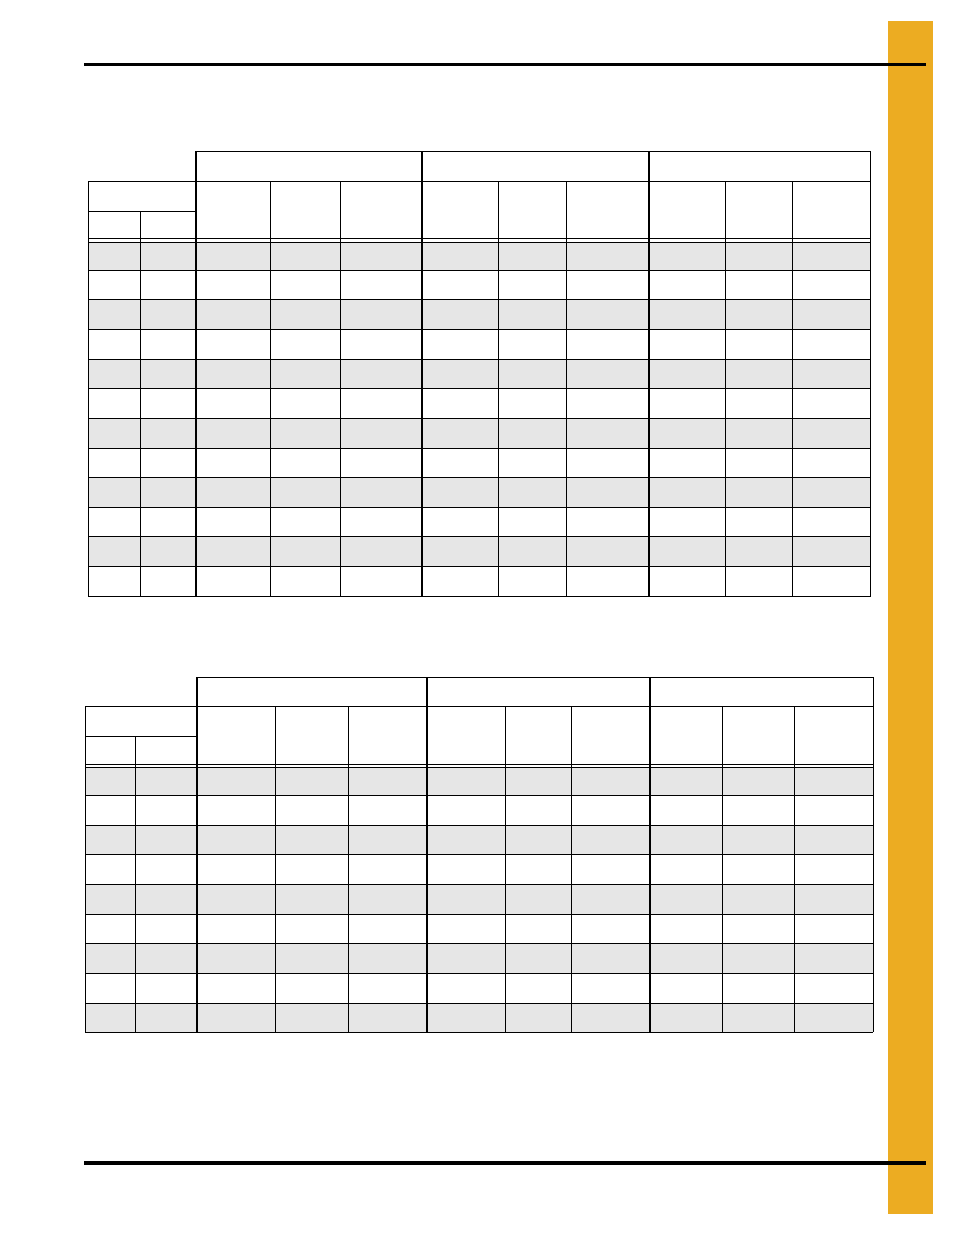
Drying Time Table……..3626 and 2000 (Continued)
Corn...Full Heat
Wheat, Barley, Milo...Dry and Cool (#1 and #2 Cooling)
The above drying capacities are estimates based on drying principles, field results and computer
simulations. Variances may occur due to grain physiological factors (kernel size, chemical composition,
variety, maturity), excessive fines, weather conditions, etc.
170°F
190°F
210°F
Moisture
% Unload
Rate
Dry Time
(Min.)
Capacity
Dry (BPH)
% Unload
Rate
Dry Time
(Min.)
Capacity
Dry (BPH)
% Unload
Rate
Dry Time
(Min.)
Capacity
Dry (BPH)
% In % Out*
21
17
100
30
3658
22
17
90
35
3239
100
30
3658
23
17
78
40
2826
91
34
3296
100
30
3658
24
17
69
45
2497
81
39
2913
92
34
3329
25
17
62
51
2220
72
44
2590
82
38
2960
26
17
55
57
1981
64
49
2311
73
43
2641
27
17
49
64
1770
57
55
2065
65
48
2360
28
17
44
72
1584
51
61
1848
59
54
2112
29
17
39
80
1420
46
69
1656
53
60
1893
30
17
35
89
1275
41
76
1488
47
67
1700
32
17
29
109
1040
34
93
1214
38
82
1387
35
17
22
142
797
26
122
930
29
107
1063
*Represents the target moisture out of the dryer. Expected final moisture in the bin is
…...
15.0%
140°F
155°F
175°F
Moisture
% Unload
Rate
Dry Time
(Min.)
Capacity
Dry (BPH)
% Unload
Rate
Dry Time
(Min.)
Capacity
Dry (BPH)
% Unload
Rate
Dry Time
(Min.)
Capacity
Dry (BPH)
% In
% Out
15
13
64
33
2314
75
28
2700
89
24
3214
16
13
48
43
1744
56
37
2035
67
31
2423
17
13
39
53
1422
46
46
1659
55
38
1975
18
13
34
63
1208
39
54
1409
47
45
1678
19
13
29
72
1050
34
62
1225
40
52
1459
20
13
26
82
925
30
70
1080
36
59
1285
21
13
23
92
822
27
79
958
32
66
1141
23
13
18
115
655
21
99
765
25
83
910
25
13
15
143
528
17
123
616
20
103
733