Drying time table…… 6 and 4263, Drying time table – Grain Systems PNEG-1915 User Manual
Page 80
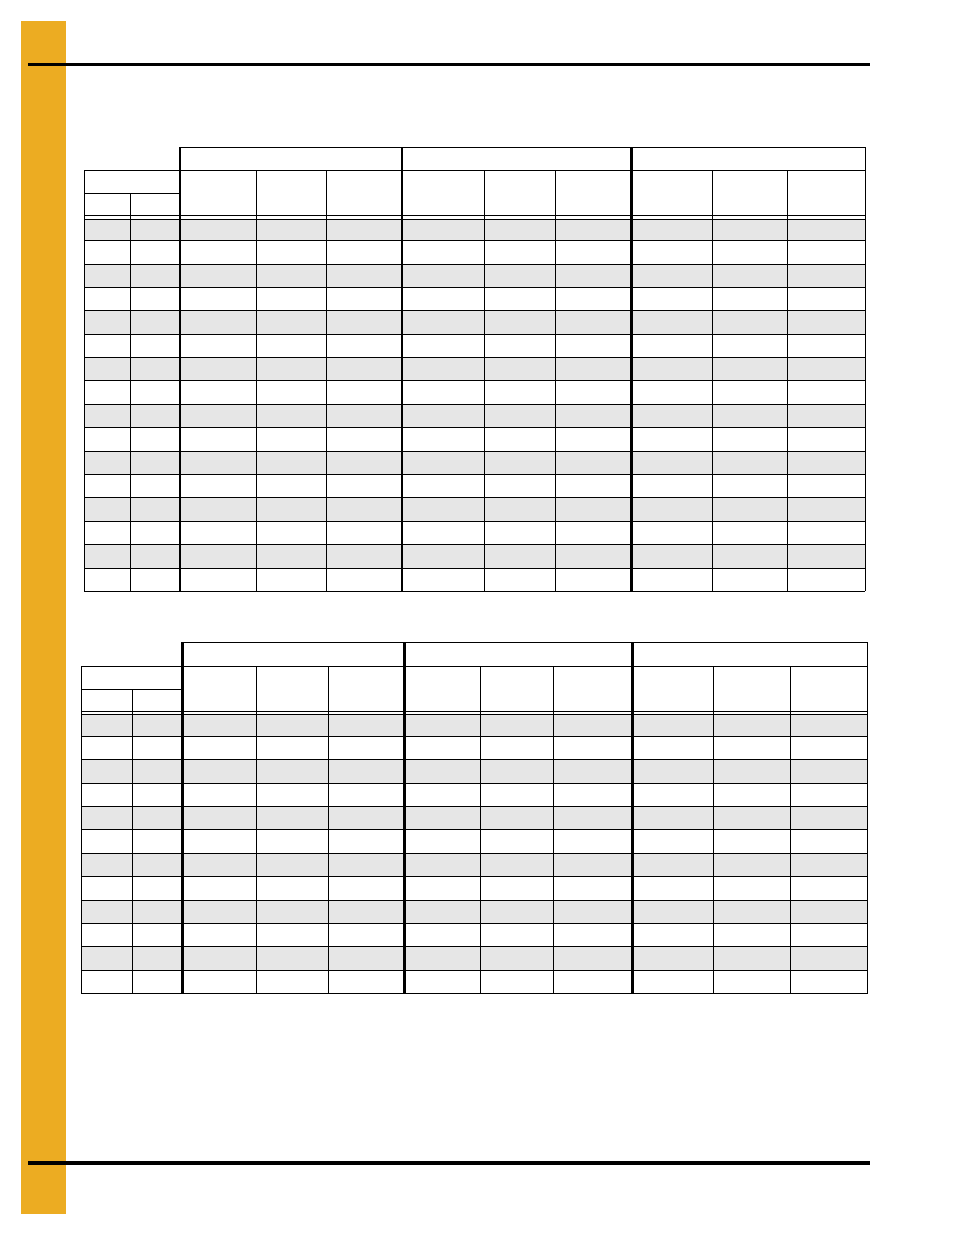
1. Drying Time Table
80
PNEG-1915 VN2 Portable Dryer Drying Charts for All Models of Vision
Drying Time Table……..3426 and 4263
Corn...Dry and Cool (#1 and #2 Cooling)
Corn...Dry and Cool (#1 Cooling)
The above drying capacities are estimates based on drying principles, field results and computer
simulations. Variances may occur due to grain physiological factors (kernel size, chemical composition,
variety, maturity), excessive fines, weather conditions, etc.
170°F
190°F
210°F
Moisture
% Unload
Rate
Dry Time
(Min.)
Capacity
Dry (BPH)
% Unload
Rate
Dry Time
(Min.)
Capacity
Dry (BPH)
% Unload
Rate
Dry Time
(Min.)
Capacity
Dry (BPH)
% In % Out
17
15
78
24
2850
91
21
3325
18
15
59
32
2148
69
27
2506
78
24
2865
19
15
48
39
1751
56
33
2043
64
29
2335
20
15
41
46
1488
47
39
1736
54
34
1984
21
15
35
53
1294
41
45
1509
47
40
1725
22
15
31
60
1140
36
51
1330
42
45
1520
23
15
28
68
1012
32
58
1181
37
51
1349
24
15
25
76
902
29
65
1053
33
57
1203
25
15
22
85
807
26
73
942
29
63
1076
26
15
20
94
724
23
81
844
26
71
965
27
15
18
105
650
21
90
758
24
79
867
28
15
16
117
586
19
100
683
21
88
781
29
15
14
129
529
17
111
617
19
97
705
30
15
13
142
480
15
122
560
17
107
639
32
15
11
171
399
13
147
466
15
128
532
35
15
9
217
315
10
186
368
11
162
421
170°F
190°F
210°F
Moisture
% Unload
Rate
Dry Time
(Min.)
Capacity
Dry (BPH)
% Unload
Rate
Dry Time
(Min.)
Capacity
Dry (BPH)
% Unload
Rate
Dry Time
(Min.)
Capacity
Dry (BPH)
% In % Out
21
15
47
53
1725
22
15
42
60
1520
48
51
1773
23
15
37
68
1349
43
58
1574
49
51
1799
24
15
33
76
1203
38
65
1404
44
57
1604
25
15
29
85
1076
34
73
1256
39
63
1435
26
15
26
94
965
31
81
1126
35
71
1286
27
15
24
105
867
28
90
1011
32
79
1156
28
15
21
117
781
25
100
911
28
88
1041
29
15
19
129
705
22
111
823
26
97
940
30
15
17
142
639
20
122
746
23
107
853
32
15
15
171
532
17
147
621
19
128
710
35
15
11
217
421
13
186
491
15
162
561
Drying table based on 100% unload rate of…...3658 BPH