Drying time table – Grain Systems PNEG-1915 User Manual
Page 72
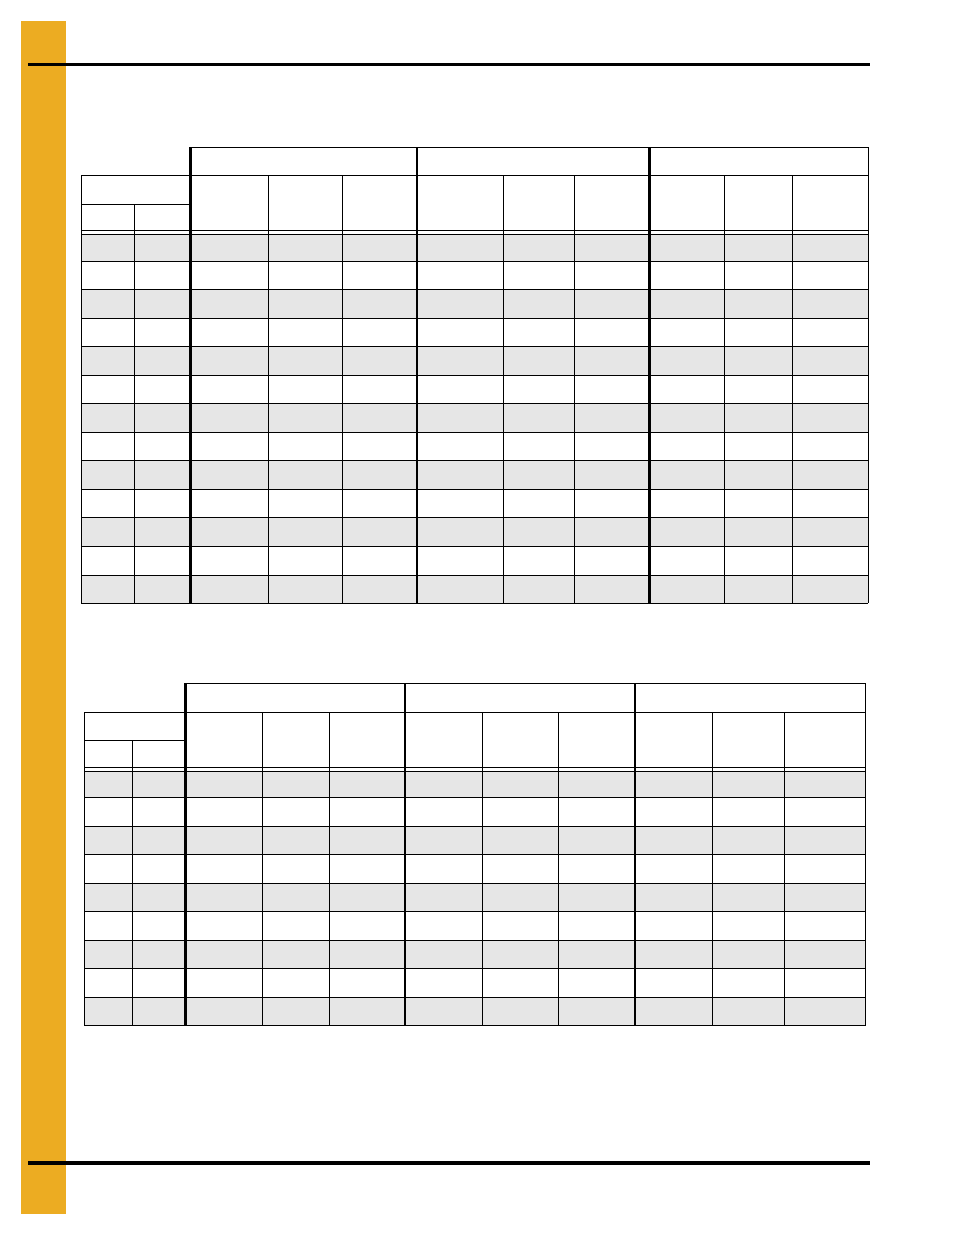
1. Drying Time Table
72
PNEG-1915 VN2 Portable Dryer Drying Charts for All Models of Vision
Drying Time Table……..3418 and 4183 (Continued)
Corn...Full Heat
Wheat, Barley, Milo...Dry and Cool (#1 and #2 Cooling)
The above drying capacities are estimates based on drying principles, field results and computer
simulations. Variances may occur due to grain physiological factors (kernel size, chemical composition,
variety, maturity), excessive fines, weather conditions, etc.
170°F
190°F
210°F
Moisture
% Unload
Rate
Dry Time
(Min.)
Capacity
Dry (BPH)
% Unload
Rate
Dry Time
(Min.)
Capacity
Dry (BPH)
% Unload
Rate
Dry Time
(Min.)
Capacity
Dry (BPH)
% In
% Out*
20
17
100
31
2533
21
17
99
32
2496
100
31
2533
22
17
84
37
2125
98
32
2479
100
31
2533
23
17
73
43
1854
85
36
2163
98
32
2472
24
17
65
48
1638
75
41
1911
86
36
2184
25
17
58
54
1456
67
46
1699
77
41
1942
26
17
51
61
1299
60
52
1516
68
46
1732
27
17
46
68
1161
53
58
1355
61
51
1548
28
17
41
76
1039
48
65
1212
55
57
1385
29
17
37
85
931
43
73
1086
49
63
1242
30
17
33
94
837
39
81
976
44
71
1116
32
17
27
116
683
31
99
796
36
87
910
35
17
21
151
523
24
129
610
28
113
697
*Represents the target moisture out of the dryer. Expected final moisture in the bin is…...15.0%
140°F
155°F
175°F
Moisture
% Unload
Rate
Dry Time
(Min.)
Capacity
Dry (BPH)
% Unload
Rate
Dry Time
(Min.)
Capacity
Dry (BPH)
% Unload
Rate
Dry Time
(Min.)
Capacity
Dry (BPH)
% In % Out
15
13
57
33
1447
67
28
1688
79
24
2010
16
13
43
43
1091
50
37
1273
60
31
1515
17
13
35
53
889
41
46
1037
49
38
1235
18
13
30
63
755
35
54
881
41
45
1049
19
13
26
72
657
30
62
766
36
52
912
20
13
23
82
579
27
70
675
32
59
804
21
13
20
92
514
24
79
599
28
66
714
23
13
16
115
410
19
99
478
22
83
569
25
13
13
143
330
15
123
385
18
103
458
Drying table based on 100% unload rate of…...2533 BPH