Drying time table – Grain Systems PNEG-1915 User Manual
Page 75
1. Drying Time Table
PNEG-1915 VN2 Portable Dryer Drying Charts for All Models of Vision
75
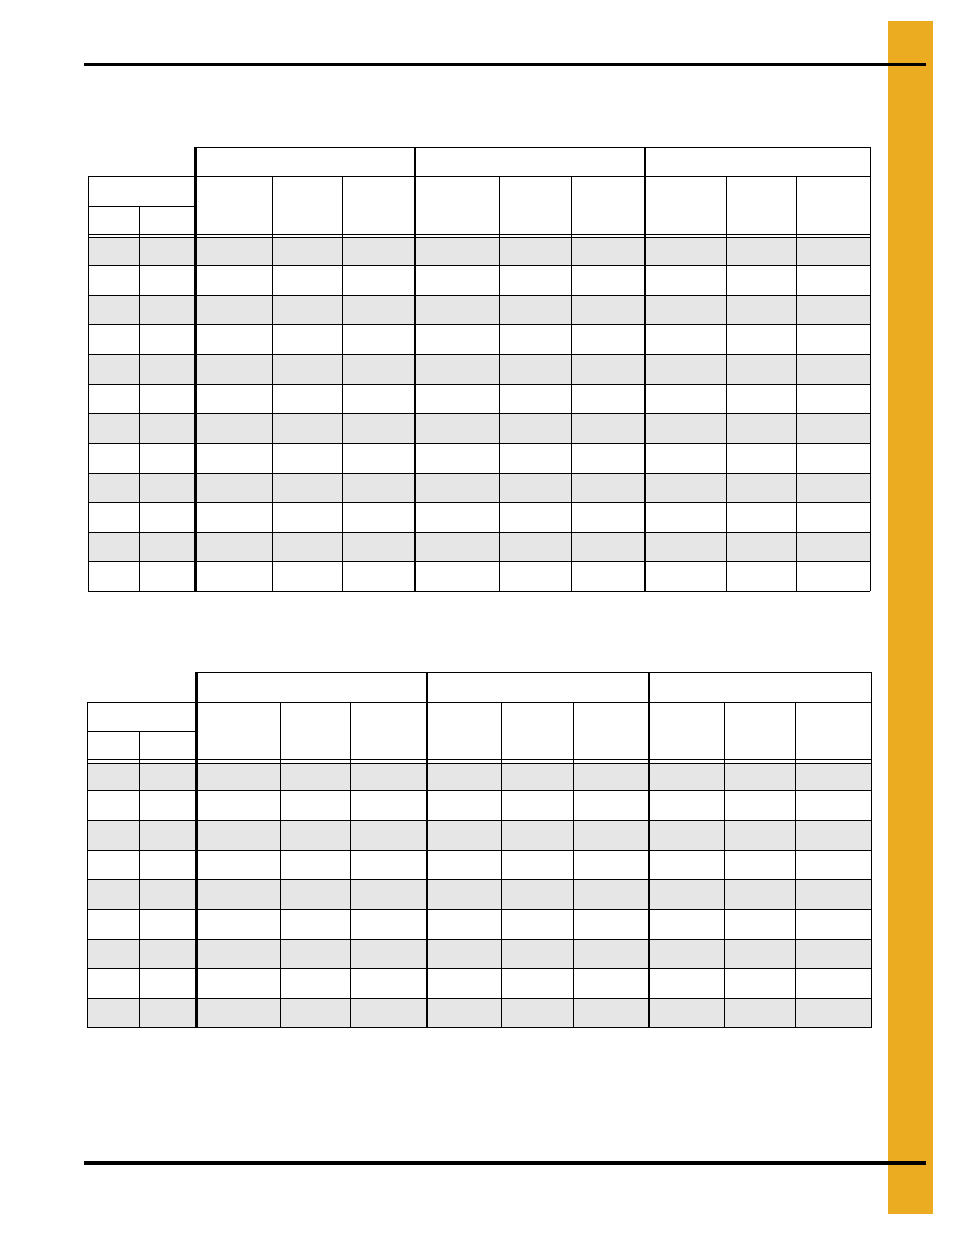
Drying Time Table……..3420 and 4203 (Continued)
Corn...Full Heat
Wheat, Barley, Milo...Dry and Cool (#1 and #2 Cooling)
The above drying capacities are estimates based on drying principles, field results and computer
simulations. Variances may occur due to grain physiological factors (kernel size, chemical composition,
variety, maturity), excessive fines, weather conditions, etc.
170°F
190°F
210°F
Moisture
% Unload
Rate
Dry Time
(Min.)
Capacity
Dry (BPH)
% Unload
Rate
Dry Time
(Min.)
Capacity
Dry (BPH)
% Unload
Rate
Dry Time
(Min.)
Capacity
Dry (BPH)
% In % Out*
21
17
100
30
2814
22
17
87
36
2446
100
31
2814
23
17
76
41
2134
88
35
2489
100
31
2814
24
17
67
46
1885
78
40
2199
89
35
2514
25
17
60
52
1676
70
45
1956
79
39
2235
26
17
53
59
1496
62
50
1745
71
44
1994
27
17
47
66
1337
55
56
1559
63
49
1782
28
17
42
73
1196
50
63
1395
57
55
1595
29
17
38
82
1072
44
70
1251
51
61
1429
30
17
34
91
963
40
78
1124
46
68
1284
32
17
28
112
786
33
96
917
37
84
1047
35
17
21
146
602
25
125
702
29
109
803
*Represents the target moisture out of the dryer. Expected final moisture in the bin is…...15.0%
140°F
155°F
175°F
Moisture
% Unload
Rate
Dry Time
(Min.)
Capacity
Dry (BPH)
% Unload
Rate
Dry Time
(Min.)
Capacity
Dry (BPH)
% Unload
Rate
Dry Time
(Min.)
Capacity
Dry (BPH)
% In
% Out
15
13
57
33
1608
67
28
1876
79
24
2233
16
13
43
43
1212
50
37
1414
60
31
1683
17
13
35
53
988
41
46
1153
49
38
1372
18
13
30
63
839
35
54
979
41
45
1166
19
13
26
72
730
30
62
851
36
52
1014
20
13
23
82
643
27
70
750
32
59
893
21
13
20
92
571
24
79
666
28
66
793
23
13
16
115
455
19
99
531
22
83
632
25
13
13
143
367
15
123
428
18
103
509
Drying table based on 100% unload rate of…...2814 BPH