Drying time table – Grain Systems PNEG-1915 User Manual
Page 54
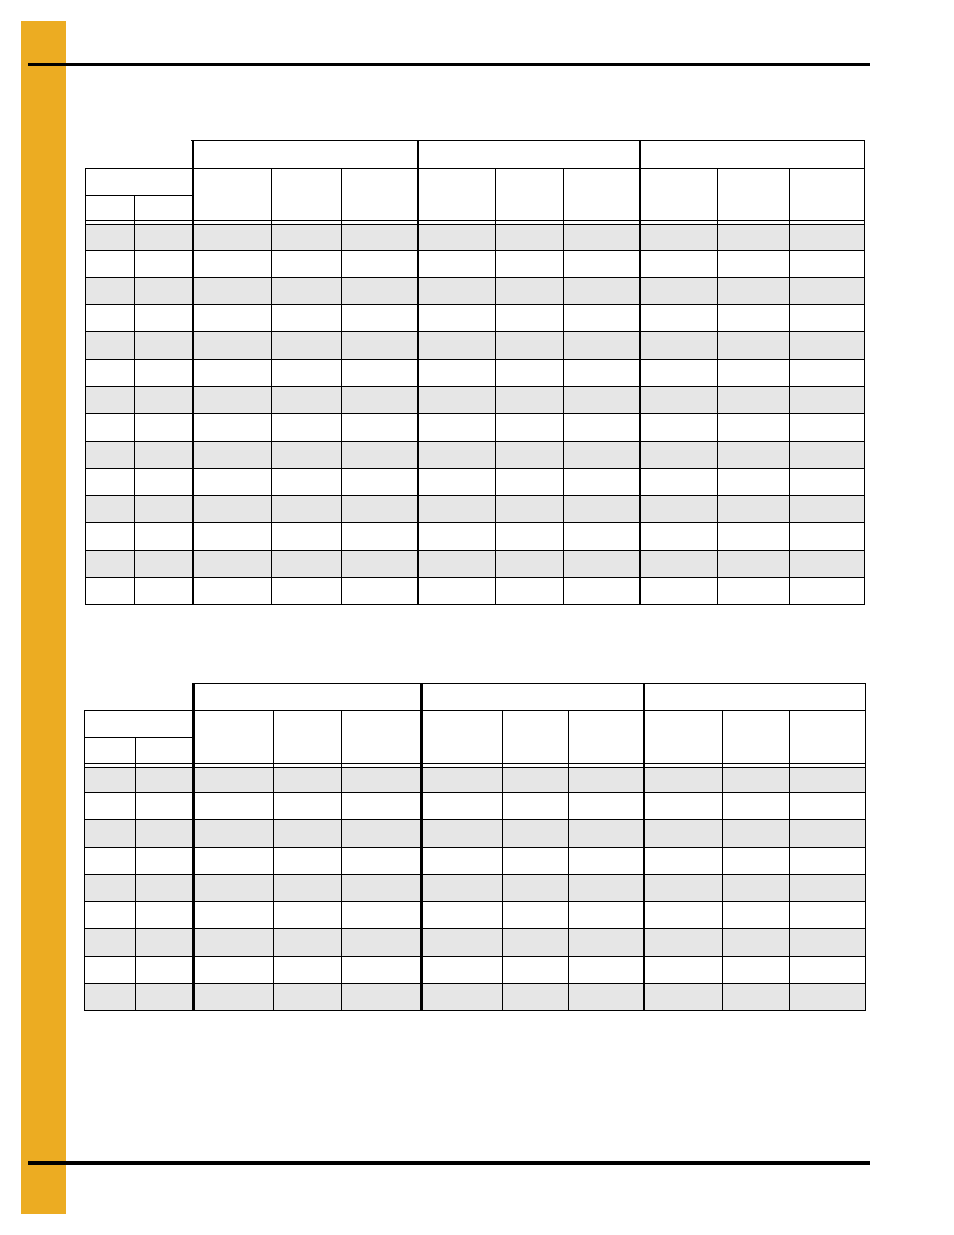
1. Drying Time Table
54
PNEG-1915 VN2 Portable Dryer Drying Charts for All Models of Vision
Drying Time Table……..2318 and 3182 (Continued)
Corn...Full Heat
Wheat, Barley, Milo...Dry and Cool (#1 and #2 Cooling)
The above drying capacities are estimates based on drying principles, field results and computer
simulations. Variances may occur due to grain physiological factors (kernel size, chemical composition,
variety, maturity), excessive fines, weather conditions, etc.
170°F
190°F
210°F
Moisture
% Unload
Rate
Dry Time
(Min.)
Capacity
Dry (BPH)
% Unload
Rate
Dry Time
(Min.)
Capacity
Dry (BPH)
% Unload
Rate
Dry Time
(Min.)
Capacity
Dry (BPH)
%
In
%
Out*
19
17
100
20
2533
100
19
2533
20
17
80
26
2038
94
22
2378
100
20
2533
21
17
65
32
1658
76
27
1934
87
24
2211
22
17
56
37
1412
65
32
1647
74
28
1882
23
17
49
43
1232
57
36
1437
65
32
1642
24
17
43
48
1088
50
41
1269
57
36
1451
25
17
38
54
968
45
46
1129
51
41
1290
26
17
34
61
863
40
52
1007
45
46
1151
27
17
30
68
771
36
58
900
41
51
1029
28
17
27
76
690
32
65
805
36
57
920
29
17
24
85
619
28
73
722
33
63
825
30
17
22
94
556
26
81
649
29
71
741
32
17
18
116
453
21
99
529
24
87
605
35
17
14
151
347
16
129
405
18
113
463
*Represents the target moisture out of the dryer. Expected final moisture in the bin is…...15.0%
140°F
155°F
175°F
Moisture
% Unload
Rate
Dry Time
(Min.)
Capacity
Dry (BPH)
% Unload
Rate
Dry Time
(Min.)
Capacity
Dry (BPH)
% Unload
Rate
Dry Time
(Min.)
Capacity
Dry (BPH)
%
In
%
Out
15
13
28
33
705
32
28
823
39
24
979
16
13
21
43
531
24
37
620
29
31
738
17
13
17
53
433
20
46
505
24
38
602
18
13
15
63
368
17
54
429
20
45
511
19
13
13
72
320
15
62
373
18
52
444
20
13
11
82
282
13
70
329
15
59
392
21
13
10
92
250
12
79
292
14
66
348
23
13
8
115
200
9
99
233
11
83
277
25
13
6
143
161
7
123
188
9
103
223
Drying table based on 100% unload rate of…...2533 BPH