Drying time table – Grain Systems PNEG-1915 User Manual
Page 66
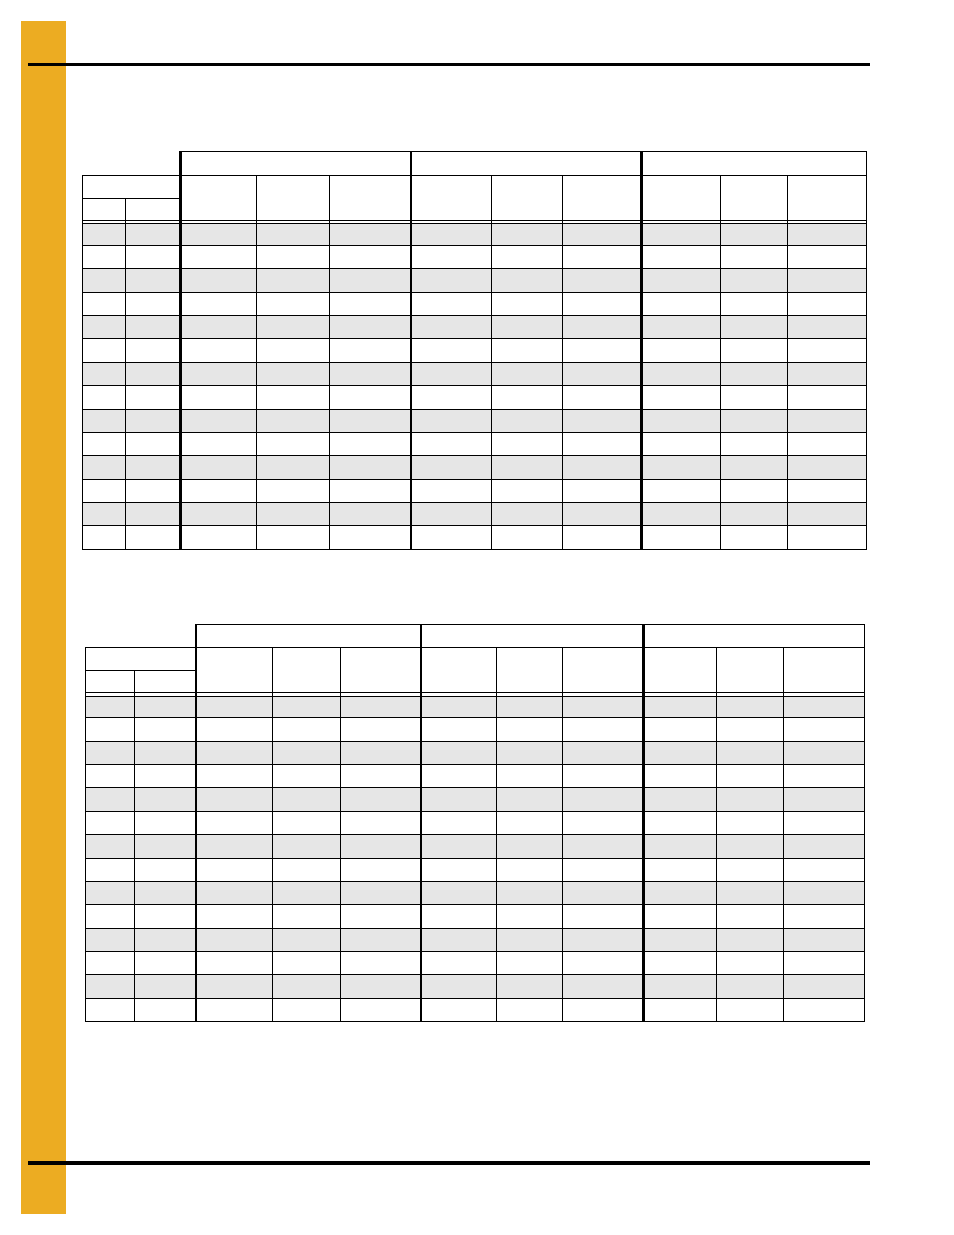
1. Drying Time Table
66
PNEG-1915 VN2 Portable Dryer Drying Charts for All Models of Vision
Drying Time Table……..2420 and 1000 (Continued)
Corn...Dry and Cool (#1 Cooling)
Corn...Full Heat
The above drying capacities are estimates based on drying principles, field results and computer
simulations. Variances may occur due to grain physiological factors (kernel size, chemical composition,
variety, maturity), excessive fines, weather conditions, etc.
170°F
190°F
210°F
Moisture
% Unload
Rate
Dry Time
(Min.)
Capacity
Dry (BPH)
% Unload
Rate
Dry Time
(Min.)
Capacity
Dry (BPH)
% Unload
Rate
Dry Time
(Min.)
Capacity
Dry (BPH)
% In % Out
19
15
42
38
1151
20
15
35
44
978
41
38
1141
21
15
31
51
850
36
44
992
41
38
1134
22
15
27
58
749
32
50
874
36
43
999
23
15
24
65
665
28
56
776
32
49
887
24
15
21
73
593
25
63
692
29
55
791
25
15
19
82
531
22
70
619
26
61
707
26
15
17
91
476
20
78
555
23
68
634
27
15
15
102
427
18
87
499
21
76
570
28
15
14
113
385
16
97
449
19
85
513
29
15
13
125
348
15
107
406
17
94
464
30
15
11
138
315
13
118
368
15
103
420
32
15
9
165
262
11
142
306
13
124
350
35
15
7
209
207
9
179
242
10
157
276
Drying table
based on 100% unload rate of
…...
2772 BPH
170°F
190°F
210°F
Moisture
% Unload
Rate
Dry Time
(Min.)
Capacity
Dry (BPH)
% Unload
Rate
Dry Time
(Min.)
Capacity
Dry (BPH)
% Unload
Rate
Dry Time
(Min.)
Capacity
Dry (BPH)
% In
% Out*
19
17
100
20
2772
20
17
86
24
2386
100
21
2772
100
20
2772
21
17
70
30
1941
82
26
2265
93
22
2589
22
17
60
35
1653
70
30
1929
80
26
2204
23
17
52
40
1442
61
34
1682
69
30
1923
24
17
46
45
1274
54
39
1486
61
34
1699
25
17
41
51
1133
48
44
1322
54
38
1511
26
17
36
57
1011
43
49
1179
49
43
1348
27
17
33
64
903
38
55
1054
43
48
1204
28
17
29
72
808
34
61
943
39
54
1078
29
17
26
80
724
30
69
845
35
60
966
30
17
23
89
651
27
76
759
31
67
868
32
17
19
109
531
22
93
619
26
82
708
35
17
15
142
407
17
122
475
20
107
542
*Represents the target moisture out of the dryer. Expected final moisture in the bin is
…...
15.0%