Drying time table – Grain Systems PNEG-1915 User Manual
Page 73
1. Drying Time Table
PNEG-1915 VN2 Portable Dryer Drying Charts for All Models of Vision
73
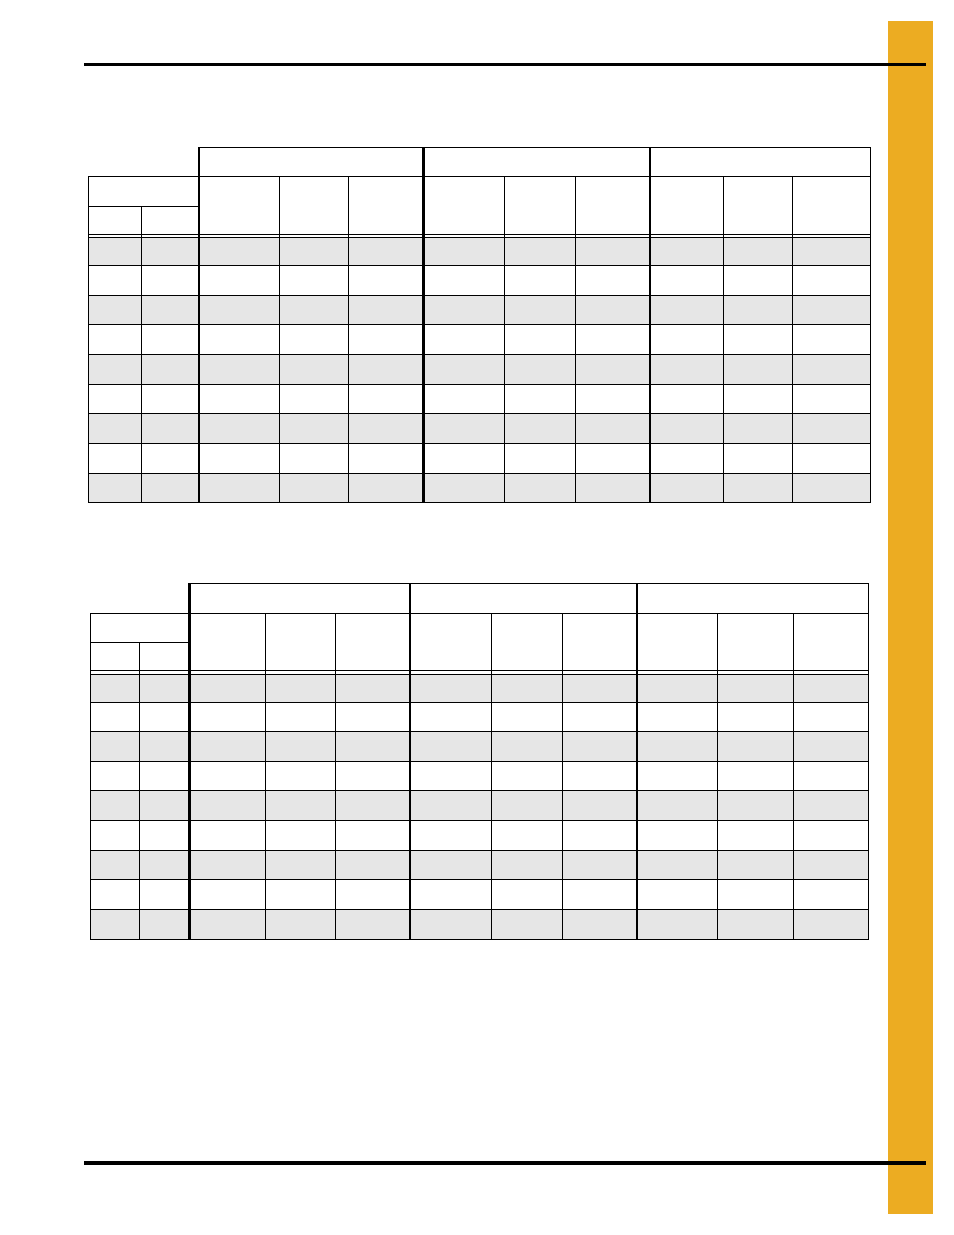
Drying Time Table……..3418 and 4183 (Continued)
Soybeans...Dry and Cool (#1 and #2 Cooling)
Canola...Dry and Cool
The above drying capacities are estimates based on drying principles, field results and computer
simulations. Variances may occur due to grain physiological factors (kernel size, chemical composition,
variety, maturity), excessive fines, weather conditions, etc.
120°F
130°F
140°F
Moisture
% Unload
Rate
Dry Time
(Min.)
Capacity
Dry (BPH)
% Unload
Rate
Dry Time
(Min.)
Capacity
Dry (BPH)
% Unload
Rate
Dry Time
(Min.)
Capacity
Dry (BPH)
% In
% Out
15
13
65
29
1641
74
25
1875
83
22
2109
16
13
49
38
1236
56
33
1413
63
30
1590
17
13
40
47
1008
45
41
1152
51
36
1296
18
13
34
55
856
39
48
979
43
43
1101
19
13
29
64
745
34
56
851
38
49
957
20
13
26
72
656
30
63
750
33
56
843
21
13
23
81
582
26
71
666
30
63
749
23
13
18
102
465
21
89
531
24
79
597
25
13
15
126
374
17
111
428
19
98
481
Drying table based on 100% unload rate of…...2533 BPH
120°F
140°F
160°F
Moisture
% Unload
Rate
Dry Time
(Min.)
Capacity
Dry (BPH)
% Unload
Rate
Dry Time
(Min.)
Capacity
Dry (BPH)
% Unload
Rate
Dry Time
(Min.)
Capacity
Dry (BPH)
% In % Out
11
9
52
36
1310
66
28
1684
81
23
2059
12
9
39
48
987
50
37
1270
61
30
1552
13
9
32
59
805
41
46
1035
50
37
1265
14
9
27
69
684
35
54
879
42
44
1075
15
9
23
80
595
30
62
764
37
51
934
16
9
21
90
524
27
70
673
32
57
823
17
9
18
102
465
24
79
598
29
65
731
18
9
16
114
415
21
89
533
26
73
652
19
9
15
128
371
19
99
477
23
81
583
Drying table based on 100% unload rate of…...2533 BPH