Drying time table…… 2 and 4223, Drying time table – Grain Systems PNEG-1915 User Manual
Page 77
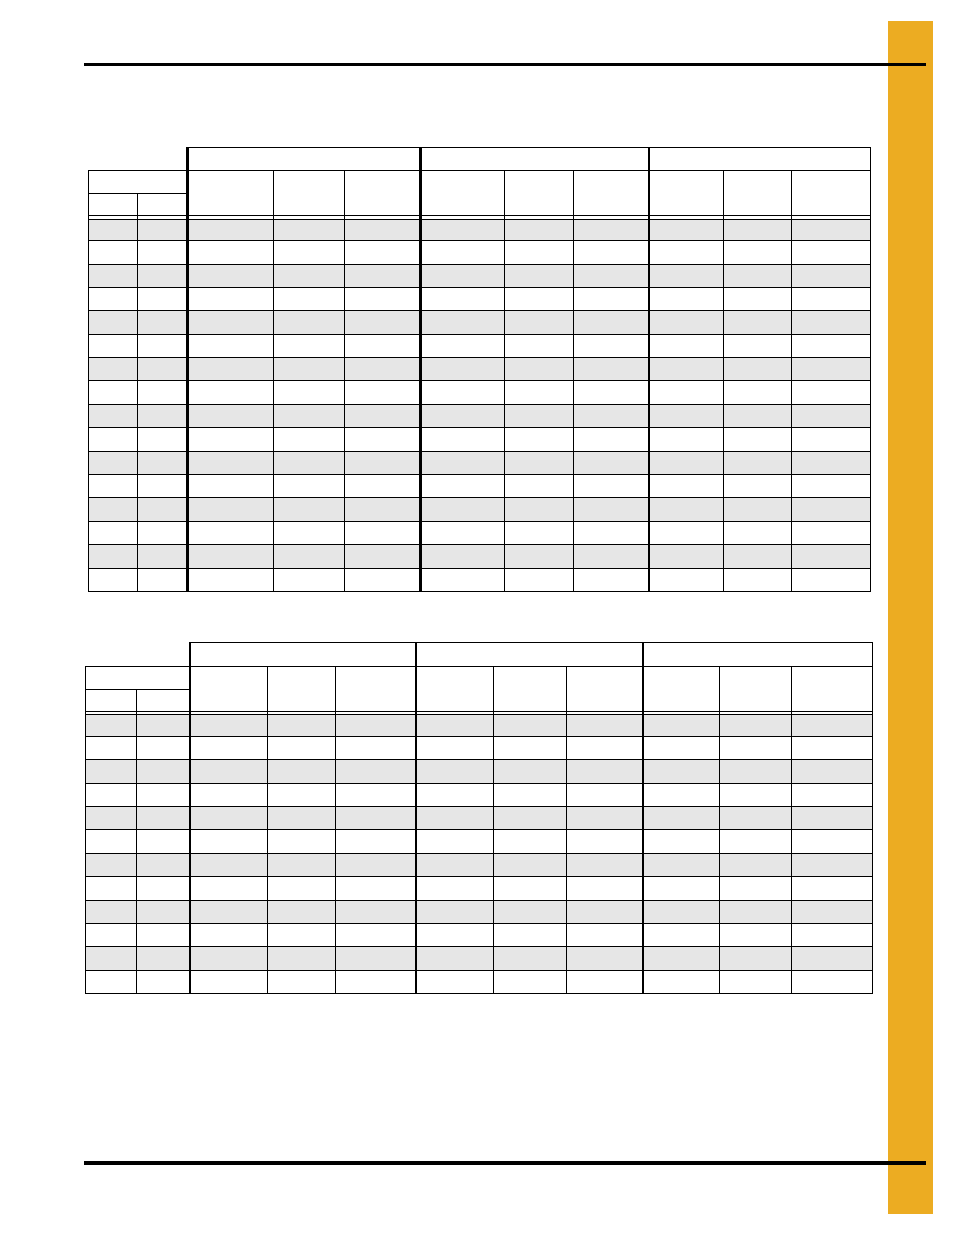
1. Drying Time Table
PNEG-1915 VN2 Portable Dryer Drying Charts for All Models of Vision
77
Drying Time Table……..3422 and 4223
Corn...Dry and Cool (#1 and #2 Cooling)
Corn...Dry and Cool (#1 Cooling)
The above drying capacities are estimates based on drying principles, field results and computer
simulations. Variances may occur due to grain physiological factors (kernel size, chemical composition,
variety, maturity), excessive fines, weather conditions, etc.
170°F
190°F
210°F
Moisture
% Unload
Rate
Dry Time
(Min.)
Capacity
Dry (BPH)
% Unload
Rate
Dry Time
(Min.)
Capacity
Dry (BPH)
% Unload
Rate
Dry Time
(Min.)
Capacity
Dry (BPH)
% In % Out
17
15
77
24
2369
89
21
2764
102
18
3159
18
15
58
32
1786
67
28
2084
77
24
2381
19
15
47
40
1456
55
34
1699
63
30
1941
20
15
40
47
1237
47
40
1443
53
35
1649
21
15
35
54
1075
41
46
1255
46
40
1434
22
15
31
61
947
36
52
1105
41
46
1263
23
15
27
69
841
32
59
981
36
52
1122
24
15
24
77
750
28
66
875
32
58
1000
25
15
22
86
671
25
74
783
29
65
895
26
15
19
96
601
23
82
702
26
72
802
27
15
17
107
540
20
92
630
23
80
721
28
15
16
119
487
18
102
568
21
89
649
29
15
14
131
440
17
113
513
19
99
586
30
15
13
145
399
15
124
465
17
109
532
32
15
11
174
332
13
149
387
14
131
443
35
15
8
220
262
10
189
306
11
165
350
170°F
190°F
210°F
Moisture
% Unload
Rate
Dry Time
(Min.)
Capacity
Dry (BPH)
% Unload
Rate
Dry Time
(Min.)
Capacity
Dry (BPH)
% Unload
Rate
Dry Time
(Min.)
Capacity
Dry (BPH)
% In
% Out
21
15
46
54
1434
22
15
41
61
1263
48
52
1474
23
15
36
69
1122
42
59
1308
48
52
1495
24
15
32
77
1000
38
66
1167
43
58
1334
25
15
29
86
895
34
74
1044
39
65
1193
26
15
26
96
802
30
82
936
35
72
1069
27
15
23
107
721
27
92
841
31
80
961
28
15
21
119
649
24
102
757
28
89
865
29
15
19
131
586
22
113
684
25
99
782
30
15
17
145
532
20
124
620
23
109
709
32
15
14
174
443
17
149
516
19
131
590
35
15
11
220
350
13
189
408
15
165
466
Drying table based on 100% unload rate of…...3095 BPH