Drying time table…… 6 and 2140, Drying time table – Grain Systems PNEG-1915 User Manual
Page 46
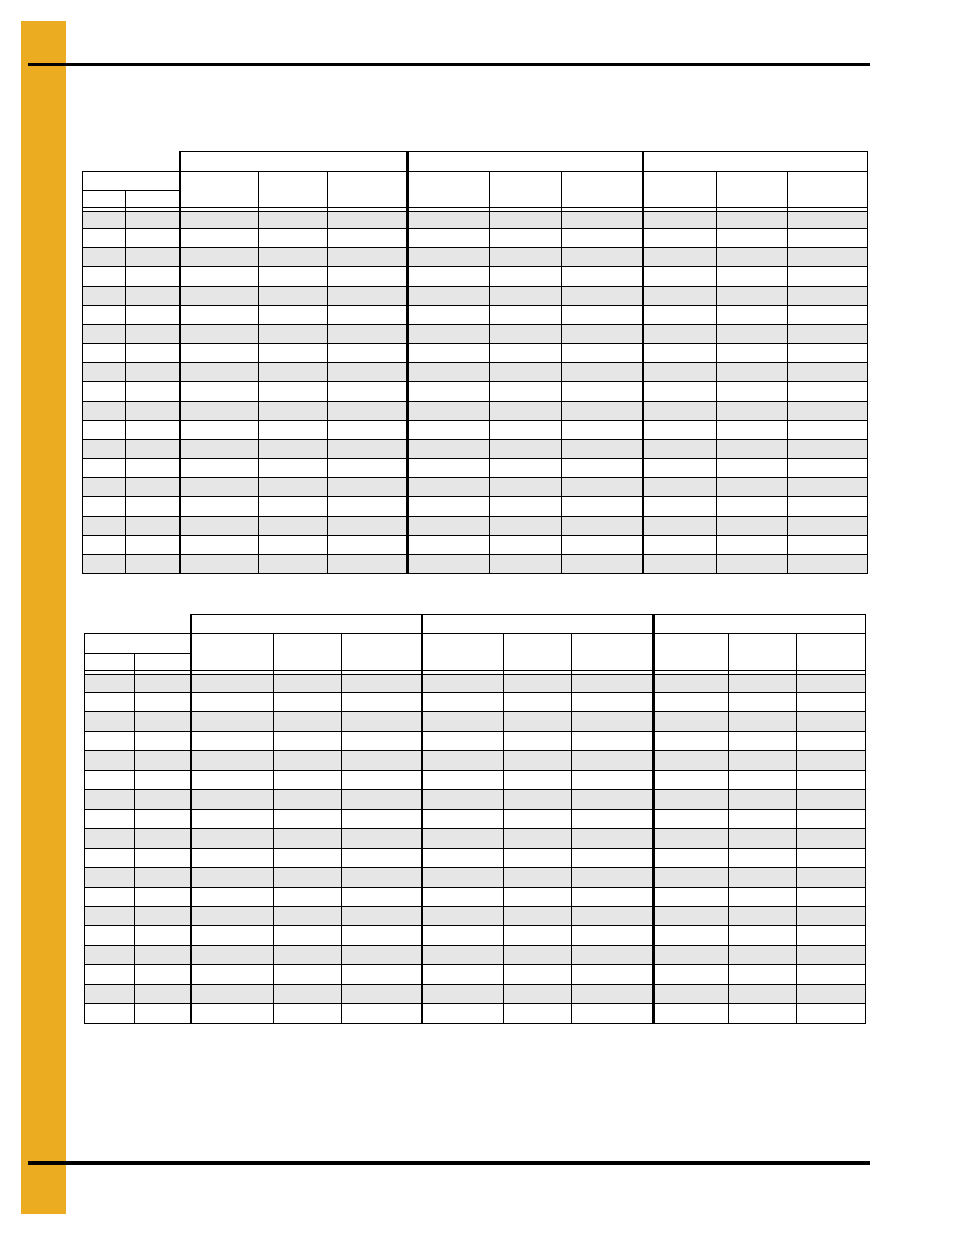
1. Drying Time Table
46
PNEG-1915 VN2 Portable Dryer Drying Charts for All Models of Vision
Drying Time Table……..1226 and 2140
Corn...Dry and Cool
Corn...Full Heat
The above drying capacities are estimates based on drying principles, field results and computer
simulations. Variances may occur due to grain physiological factors (kernel size, chemical composition,
variety, maturity), excessive fines, weather conditions, etc.
190°F
210°F
230°F
Moisture
% Unload
Rate
Dry Time
(Min.)
Capacity
Dry (BPH)
% Unload
Rate
Dry Time
(Min.)
Capacity
Dry (BPH)
% Unload
Rate
Dry Time
(Min.)
Capacity
Dry (BPH)
% In
% Out
17
15
33
20
1221
38
17
1396
18
15
25
26
921
29
23
1052
19
15
21
32
751
23
28
858
26
25
965
20
15
17
38
638
20
33
729
22
29
820
21
15
15
43
554
17
38
634
19
34
713
22
15
13
49
488
15
43
558
17
38
628
23
15
12
55
434
14
48
496
15
43
558
24
15
11
62
387
12
54
442
14
48
497
25
15
9
69
346
11
61
395
12
54
445
26
15
8
77
310
10
68
354
11
60
399
27
15
8
86
279
9
75
318
10
67
358
28
15
7
95
251
8
83
287
9
74
323
29
15
6
106
227
7
92
259
8
82
291
30
15
6
116
206
6
102
235
7
91
264
31
15
5
128
187
6
112
214
7
99
241
32
15
5
140
171
5
122
196
6
109
220
33
15
4
152
157
5
133
180
6
118
202
34
15
4
165
145
5
144
166
5
128
187
35
15
4
177
135
4
155
154
5
138
174
190°F
210°F
230°F
Moisture
% Unload
Rate
Dry Time
(Min.)
Capacity
Dry (BPH)
% Unload
Rate
Dry Time
(Min.)
Capacity
Dry (BPH)
% Unload
Rate
Dry Time
(Min.)
Capacity
Dry (BPH)
% In
% Out*
18
17
100
10
3658
100
9
3658
19
17
64
15
2356
74
13
2692
83
12
3029
20
17
48
21
1750
55
18
2000
62
16
2250
21
17
39
25
1424
44
22
1627
50
20
1831
22
17
33
30
1212
38
26
1385
43
23
1559
23
17
29
34
1057
33
30
1209
37
26
1360
24
17
26
38
934
29
34
1068
33
30
1201
25
17
23
43
831
26
38
950
29
34
1068
26
17
20
48
741
23
42
847
26
38
953
27
17
18
54
662
21
47
757
23
42
852
28
17
16
61
593
19
53
677
21
47
762
29
17
15
68
531
17
59
607
19
53
683
30
17
13
75
477
15
66
545
17
58
614
31
17
12
83
430
13
73
492
15
65
553
32
17
11
92
389
12
81
445
14
72
501
33
17
10
101
354
11
89
405
12
79
455
34
17
9
111
324
10
97
370
11
86
417
35
17
8
120
298
9
105
341
10
94
384
*Represents the target moisture out of the dryer. Expected final moisture in the bin is…...15.0%
Drying table based on 100% unload rate of…...3658 BPH