Drying time table…… 0 and 1500, Drying time table – Grain Systems PNEG-1915 User Manual
Page 83
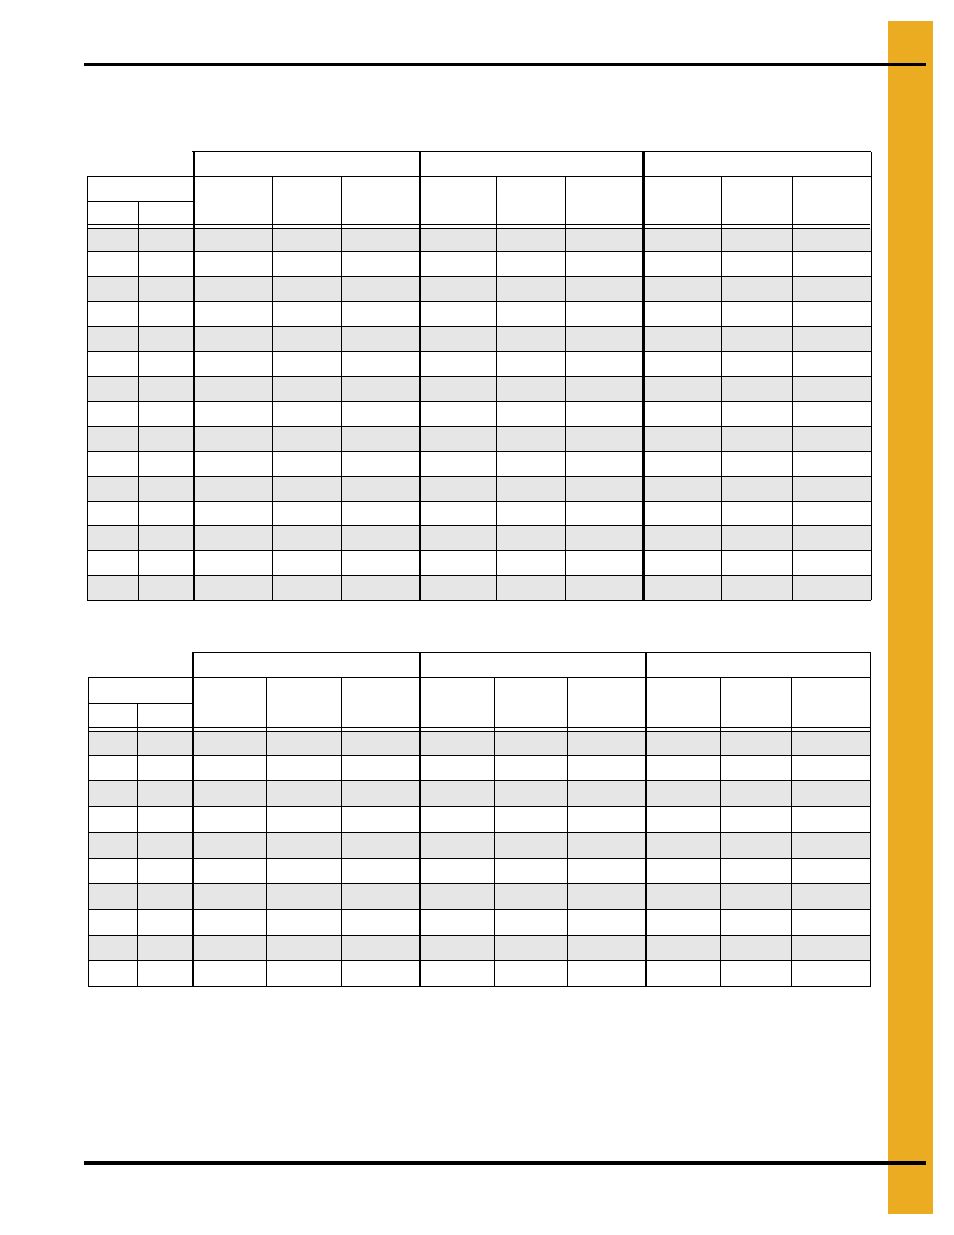
1. Drying Time Table
PNEG-1915 VN2 Portable Dryer Drying Charts for All Models of Vision
83
Drying Time Table……..3620 and 1500
Corn...Dry and Cool (#1 and #2 Cooling)
Corn...Dry and Cool (#1 Cooling)
The above drying capacities are estimates based on drying principles, field results and computer
simulations. Variances may occur due to grain physiological factors (kernel size, chemical composition,
variety, maturity), excessive fines, weather conditions, etc.
170°F
190°F
210°F
Moisture
% Unload
Rate
Dry Time
(Min.)
Capacity
Dry (BPH)
% Unload
Rate
Dry Time
(Min.)
Capacity
Dry (BPH)
% Unload
Rate
Dry Time
(Min.)
Capacity
Dry (BPH)
% In
% Out
18
15
69
31
1906
80
26
2223
19
15
56
38
1554
65
32
1813
75
28
2072
20
15
48
44
1320
56
38
1540
63
33
1760
21
15
41
51
1148
48
44
1339
55
38
1530
22
15
36
58
1011
43
50
1180
49
43
1348
23
15
32
65
898
38
56
1047
43
49
1197
24
15
29
73
801
34
63
934
39
55
1067
25
15
26
82
716
30
70
835
34
61
955
26
15
23
91
642
27
78
749
31
68
856
27
15
21
102
577
24
87
673
28
76
769
28
15
19
113
519
22
97
606
25
85
693
29
15
17
125
469
20
107
547
23
94
626
30
15
15
138
425
18
118
496
20
103
567
32
15
13
165
354
15
142
413
17
124
472
35
15
10
209
280
12
179
326
13
157
373
170°F
190°F
210°F
Moisture
% Unload
Rate
Dry Time
(Min.)
Capacity
Dry (BPH)
% Unload
Rate
Dry Time
(Min.)
Capacity
Dry (BPH)
% Unload
Rate
Dry Time
(Min.)
Capacity
Dry (BPH)
% In
% Out
23
15
40
65
1122
24
15
36
73
1001
42
63
1167
25
15
32
82
895
38
70
1044
43
61
1193
26
15
29
91
802
34
78
936
39
68
1070
27
15
26
102
721
30
87
841
35
76
961
28
15
23
113
649
27
97
757
31
85
866
29
15
21
125
587
25
107
684
28
94
782
30
15
19
138
532
22
118
620
26
103
709
32
15
16
165
443
19
142
516
21
124
590
35
15
13
209
350
15
179
408
17
157
466
Drying table based on 100% unload rate of…...2772 BPH