Drying time table – Grain Systems PNEG-1915 User Manual
Page 78
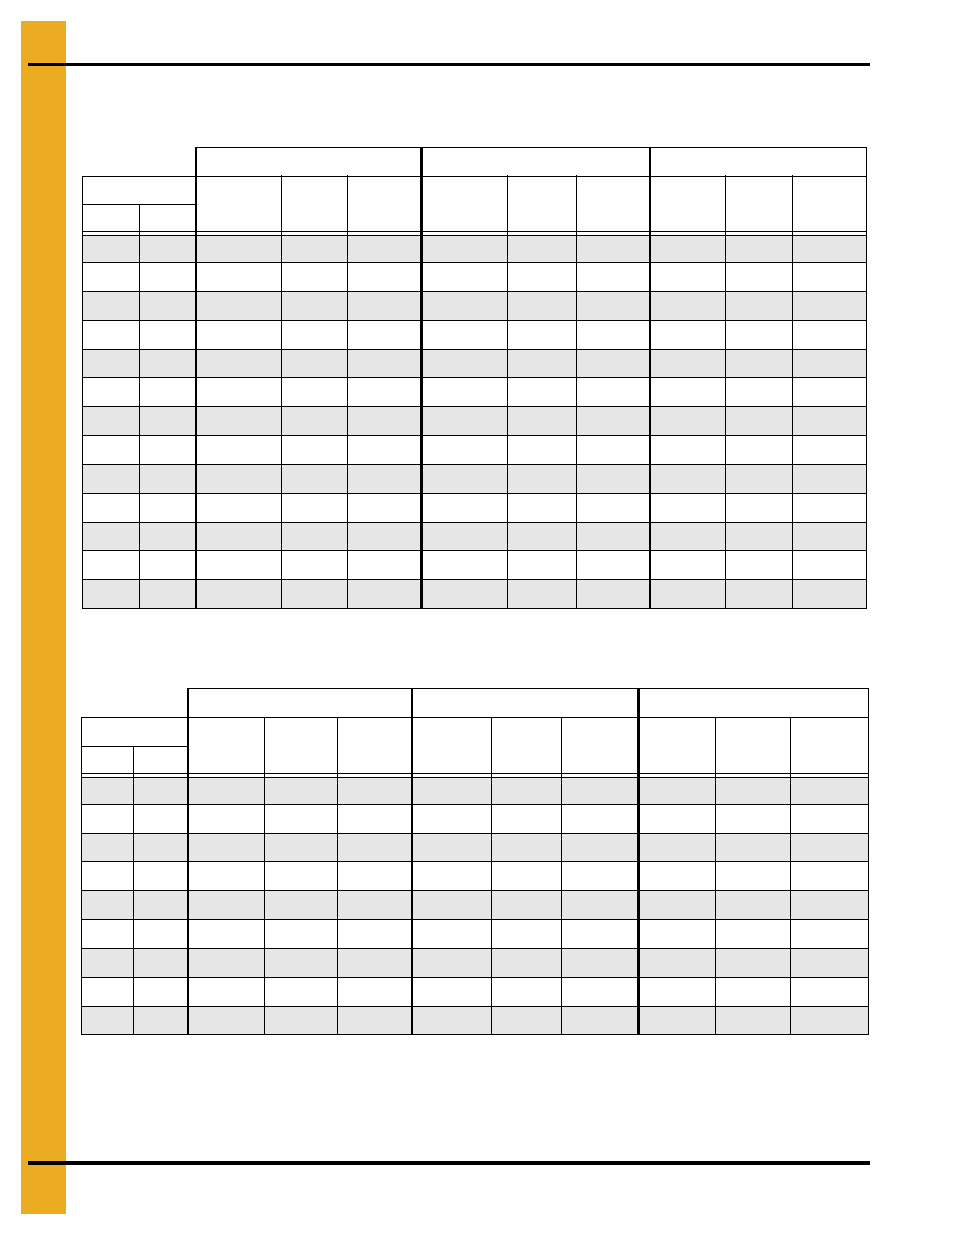
1. Drying Time Table
78
PNEG-1915 VN2 Portable Dryer Drying Charts for All Models of Vision
Drying Time Table……..3422 and 4223 (Continued)
Corn...Full Heat
Wheat, Barley, Milo...Dry and Cool (#1 and #2 Cooling)
The above drying capacities are estimates based on drying principles, field results and computer
simulations. Variances may occur due to grain physiological factors (kernel size, chemical composition,
variety, maturity), excessive fines, weather conditions, etc.
170°F
190°F
210°F
Moisture
% Unload
Rate
Dry Time
(Min.)
Capacity
Dry (BPH)
% Unload
Rate
Dry Time
(Min.)
Capacity
Dry (BPH)
% Unload
Rate
Dry Time
(Min.)
Capacity
Dry (BPH)
% In
% Out*
20
17
100
30
3095
21
17
99
31
3069
100
31
3095
22
17
84
37
2613
98
32
3049
100
31
3095
23
17
74
42
2279
86
36
2659
98
32
3039
24
17
65
48
2014
76
41
2350
87
36
2685
25
17
58
54
1791
68
46
2089
77
40
2388
26
17
52
60
1598
60
52
1864
69
45
2130
27
17
46
67
1428
54
58
1666
62
51
1904
28
17
41
75
1278
48
65
1491
55
57
1703
29
17
37
84
1145
43
72
1336
49
63
1527
30
17
33
94
1029
39
80
1200
44
70
1372
32
17
27
115
839
32
98
979
36
86
1119
35
17
21
150
643
24
128
750
28
112
857
*Represents the target moisture out of the dryer. Expected final moisture in the bin is…...15.0%
140°F
155°F
175°F
Moisture
% Unload
Rate
Dry Time
(Min.)
Capacity
Dry (BPH)
% Unload
Rate
Dry Time
(Min.)
Capacity
Dry (BPH)
% Unload
Rate
Dry Time
(Min.)
Capacity
Dry (BPH)
% In
% Out
15
13
57
33
1769
67
28
2064
79
24
2457
16
13
43
43
1333
50
37
1555
60
31
1852
17
13
35
53
1087
41
46
1268
49
38
1510
18
13
30
63
923
35
54
1077
41
45
1282
19
13
26
72
803
30
62
937
36
52
1115
20
13
23
82
707
27
70
825
32
59
982
21
13
20
92
628
24
79
733
28
66
872
23
13
16
115
501
19
99
584
22
83
696
25
13
13
143
403
15
123
471
18
103
560
Drying table based on 100% unload rate of…...3095 BPH