Drying time table…… 2, 2132 and 1222h, d510, Drying time table – Grain Systems PNEG-1915 User Manual
Page 42
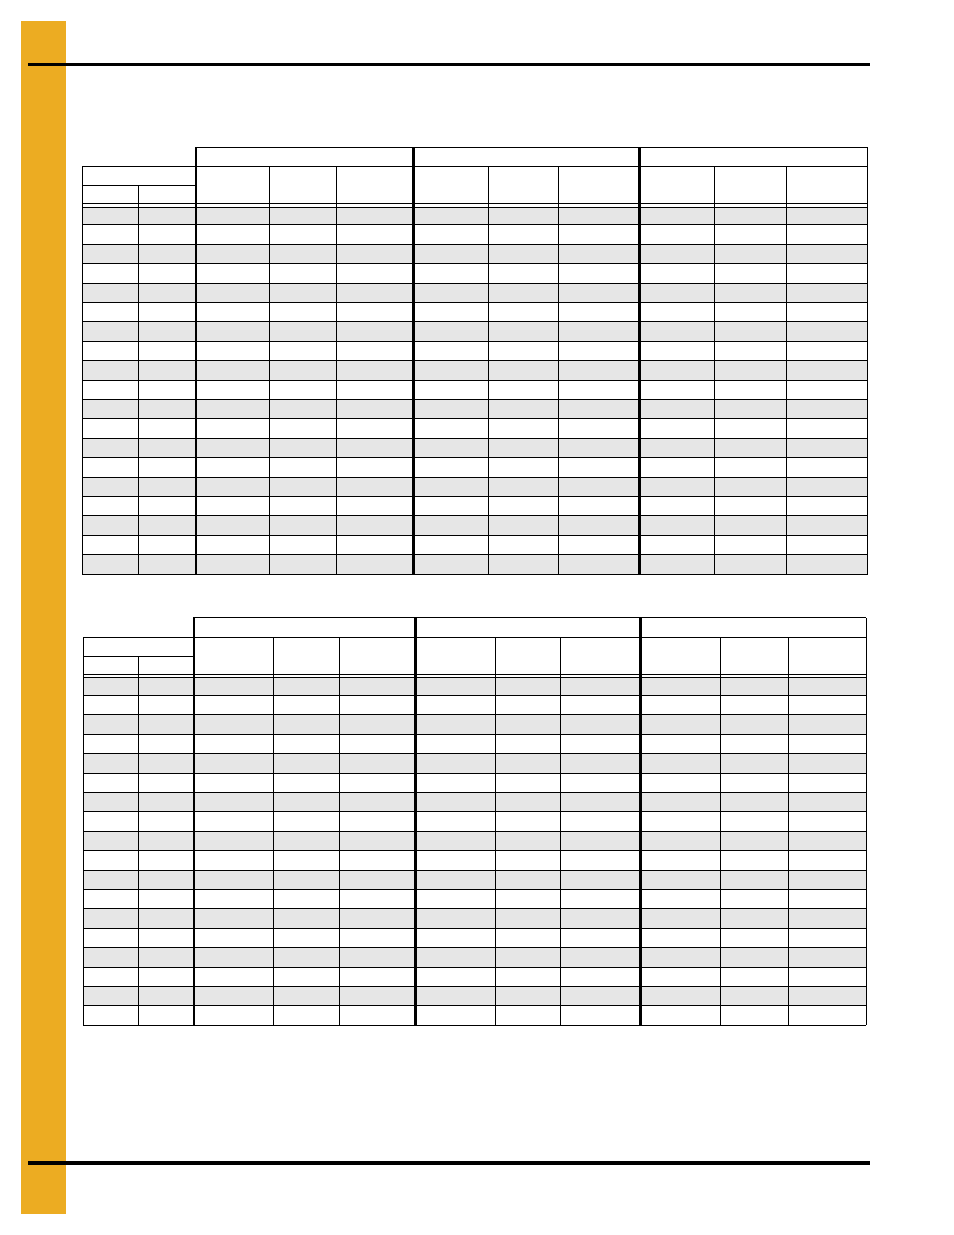
1. Drying Time Table
42
PNEG-1915 VN2 Portable Dryer Drying Charts for All Models of Vision
Drying Time Table……..1222, 2132 and 1222H, D510
Corn...Dry and Cool
Corn...Full Heat
The above drying capacities are estimates based on drying principles, field results and computer
simulations. Variances may occur due to grain physiological factors (kernel size, chemical composition,
variety, maturity), excessive fines, weather conditions, etc.
190°F
210°F
230°F
Moisture
% Unload
Rate
Dry Time
(Min.)
Capacity
Dry (BPH)
% Unload
Rate
Dry Time
(Min.)
Capacity
Dry (BPH)
% Unload
Rate
Dry Time
(Min.)
Capacity
Dry (BPH)
% In
% Out
17
15
32
21
997
37
18
1139
18
15
24
28
751
28
24
859
19
15
20
34
613
23
30
700
25
26
788
20
15
17
40
520
19
35
595
22
31
669
21
15
15
46
452
17
40
517
19
36
582
22
15
13
52
399
15
45
456
17
40
513
23
15
11
58
354
13
51
404
15
45
455
24
15
10
66
316
12
57
361
13
51
406
25
15
9
73
282
10
64
323
12
57
363
26
15
8
82
253
9
72
289
11
64
325
27
15
7
91
227
8
80
260
9
71
292
28
15
7
101
205
8
88
234
9
79
263
29
15
6
112
185
7
98
211
8
87
238
30
15
5
123
168
6
108
192
7
96
216
31
15
5
135
153
6
119
175
6
105
196
32
15
5
148
140
5
130
160
6
115
180
33
15
4
161
128
5
141
147
5
125
165
34
15
4
174
119
4
153
136
5
136
153
35
15
4
187
110
4
164
126
5
146
142
190°F
210°F
230°F
Moisture
% Unload
Rate
Dry Time
(Min.)
Capacity
Dry (BPH)
% Unload
Rate
Dry Time
(Min.)
Capacity
Dry (BPH)
% Unload
Rate
Dry Time
(Min.)
Capacity
Dry (BPH)
% In
% Out*
18
17
100
10
3095
100
9
3095
19
17
62
16
1923
71
14
2197
80
13
2472
20
17
46
22
1428
53
19
1632
59
17
1836
21
17
38
27
1162
43
23
1328
48
21
1494
22
17
32
31
989
37
27
1131
41
24
1272
23
17
28
36
863
32
31
986
36
28
1110
24
17
25
41
763
28
36
872
32
32
980
25
17
22
46
678
25
40
775
28
36
872
26
17
20
51
605
22
45
691
25
40
778
27
17
17
57
541
20
50
618
22
45
695
28
17
16
64
484
18
56
553
20
50
622
29
17
14
72
434
16
63
496
18
56
558
30
17
13
80
390
14
70
445
16
62
501
31
17
11
88
351
13
77
401
15
69
451
32
17
10
98
318
12
85
363
13
76
409
33
17
9
107
289
11
94
330
12
83
372
34
17
9
117
264
10
103
302
11
91
340
35
17
8
127
244
9
111
278
10
99
313
*Represents the target moisture out of the dryer. Expected final moisture in the bin is…...15.0%
Drying table based on 100% unload rate of…...3095 BPH