Drying time table – Grain Systems PNEG-1915 User Manual
Page 81
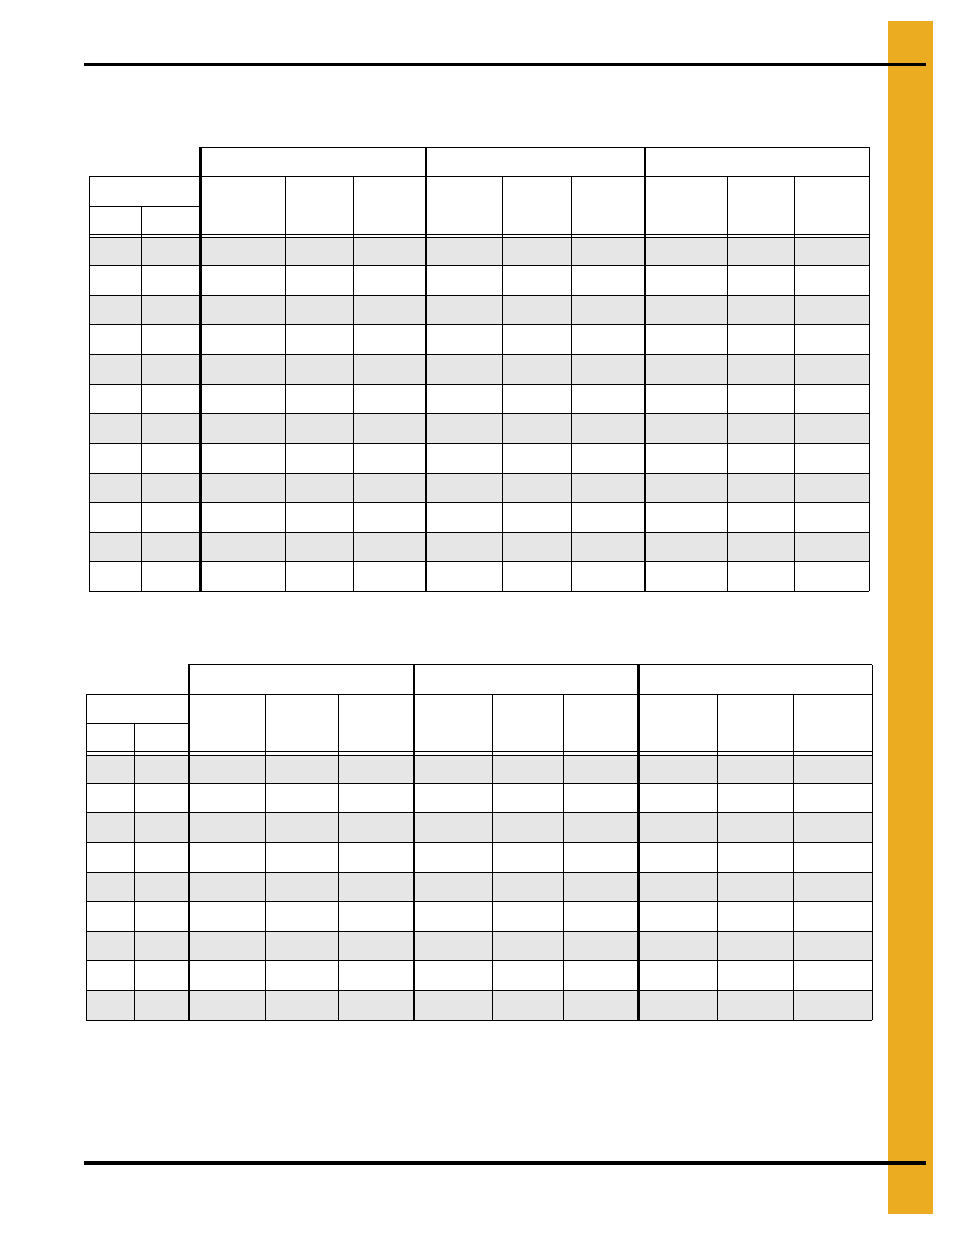
1. Drying Time Table
PNEG-1915 VN2 Portable Dryer Drying Charts for All Models of Vision
81
Drying Time Table……..3426 and 4263 (Continued)
Corn...Full Heat
Wheat, Barley, Milo...Dry and Cool (#1 and #2 Cooling)
The above drying capacities are estimates based on drying principles, field results and computer
simulations. Variances may occur due to grain physiological factors (kernel size, chemical composition,
variety, maturity), excessive fines, weather conditions, etc.
170°F
190°F
210°F
Moisture
% Unload
Rate
Dry Time
(Min.)
Capacity
Dry (BPH)
% Unload
Rate
Dry Time
(Min.)
Capacity
Dry (BPH)
% Unload
Rate
Dry Time
(Min.)
Capacity
Dry (BPH)
% In
% Out*
21
17
100
31
3658
22
17
86
36
3143
100
31
3658
23
17
75
42
2742
87
36
3199
100
31
3658
24
17
66
47
2423
77
40
2826
88
35
3230
25
17
59
53
2155
69
45
2514
79
40
2873
26
17
53
59
1922
61
51
2242
70
44
2563
27
17
47
66
1718
55
57
2004
63
50
2290
28
17
42
74
1537
49
64
1793
56
56
2049
29
17
38
83
1378
44
71
1607
50
62
1837
30
17
34
92
1238
39
79
1444
45
69
1650
32
17
28
113
1010
32
97
1178
37
85
1346
35
17
21
147
774
25
126
903
28
110
1031
*Represents the target moisture out of the dryer. Expected final moisture in the bin is…...15.0%
140°F
155°F
175°F
Moisture
% Unload
Rate
Dry Time
(Min.)
Capacity
Dry (BPH)
% Unload
Rate
Dry Time
(Min.)
Capacity
Dry (BPH)
% Unload
Rate
Dry Time
(Min.)
Capacity
Dry (BPH)
% In % Out
15
13
57
33
2090
67
28
2439
79
24
2903
16
13
43
43
1576
50
37
1838
60
31
2188
17
13
35
53
1284
41
46
1499
49
38
1784
18
13
30
63
1091
35
54
1273
41
45
1516
19
13
26
72
949
30
62
1107
36
52
1318
20
13
23
82
836
27
70
975
32
59
1161
21
13
20
92
742
24
79
866
28
66
1031
23
13
16
115
592
19
99
691
22
83
822
25
13
13
143
477
15
123
556
18
103
662
Drying table based on 100% unload rate of…...3658 BPH