Drying time table – Grain Systems PNEG-1915 User Manual
Page 76
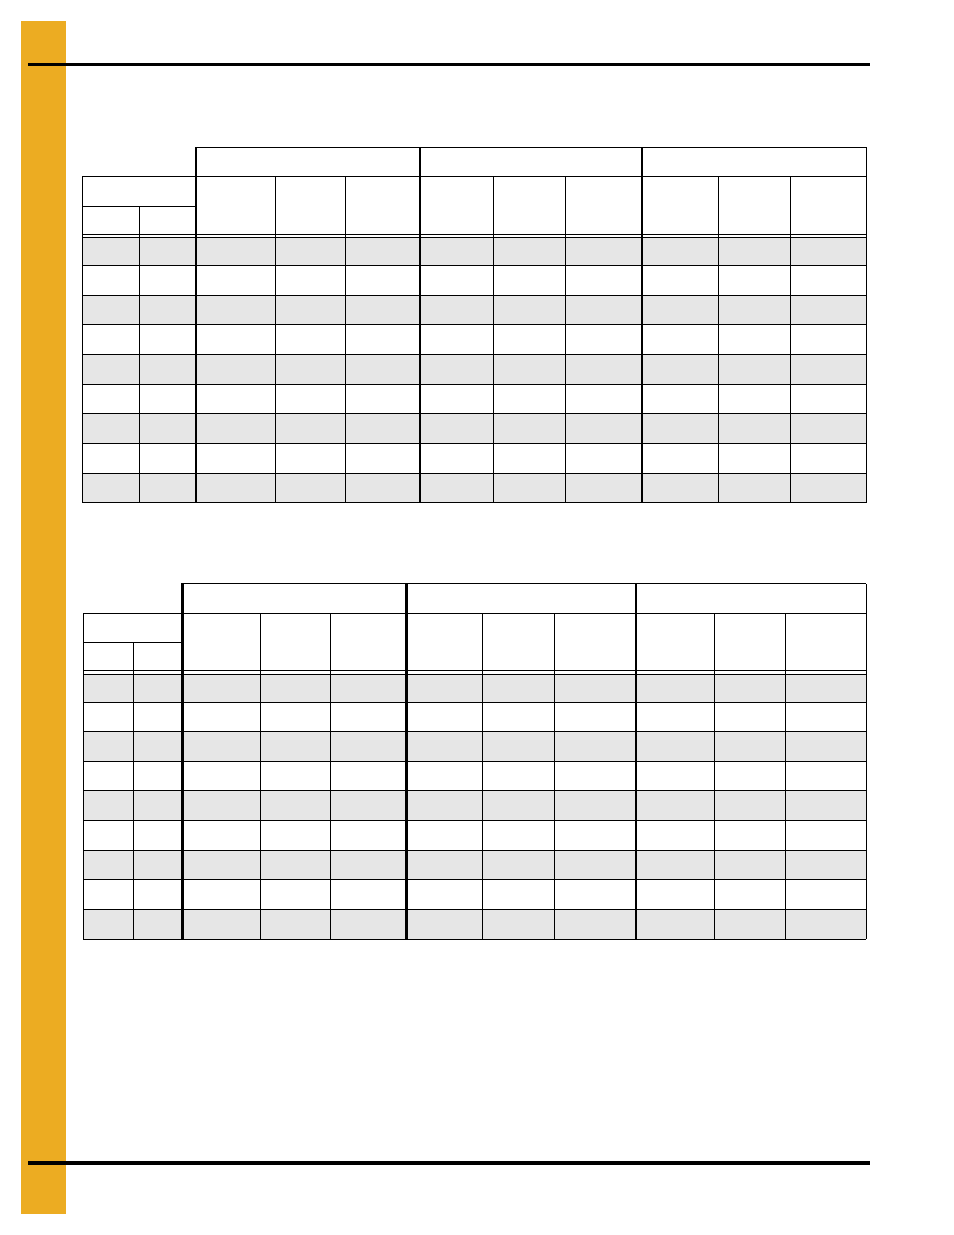
1. Drying Time Table
76
PNEG-1915 VN2 Portable Dryer Drying Charts for All Models of Vision
Drying Time Table……..3420 and 4203 (Continued)
Soybeans...Dry and Cool (#1 and #2 Cooling)
Canola...Dry and Cool
The above drying capacities are estimates based on drying principles, field results and computer
simulations. Variances may occur due to grain physiological factors (kernel size, chemical composition,
variety, maturity), excessive fines, weather conditions, etc.
120°F
130°F
140°F
Moisture
% Unload
Rate
Dry Time
(Min.)
Capacity
Dry (BPH)
% Unload
Rate
Dry Time
(Min.)
Capacity
Dry (BPH)
% Unload
Rate
Dry Time
(Min.)
Capacity
Dry (BPH)
% In
% Out
15
13
65
29
1823
74
25
2083
83
22
2344
16
13
49
38
1374
56
33
1570
63
30
1766
17
13
40
47
1120
45
41
1280
51
36
1440
18
13
34
55
952
39
48
1087
43
43
1223
19
13
29
64
827
34
56
945
38
49
1064
20
13
26
72
729
30
63
833
33
56
937
21
13
23
81
647
26
71
740
30
63
832
23
13
18
102
516
21
89
590
24
79
664
25
13
15
126
416
17
111
475
19
98
534
Drying table based on 100% unload rate of…...2814 BPH
120°F
140°F
160°F
Moisture
% Unload
Rate
Dry Time
(Min.)
Capacity
Dry (BPH)
% Unload
Rate
Dry Time
(Min.)
Capacity
Dry (BPH)
% Unload
Rate
Dry Time
(Min.)
Capacity
Dry (BPH)
% In % Out
11
9
55
34
1534
70
27
1973
86
22
2411
12
9
41
45
1156
53
35
1487
65
29
1817
13
9
34
56
943
43
43
1212
53
35
1481
14
9
28
66
801
37
51
1030
45
42
1259
15
9
25
75
696
32
59
895
39
48
1094
16
9
22
86
614
28
67
789
34
55
964
17
9
19
96
545
25
75
700
30
61
856
18
9
17
108
486
22
84
625
27
69
763
19
9
15
121
434
20
94
559
24
77
683
Drying table based on 100% unload rate of…...2814 BPH