Drying time table…… 4 and 4143, Drying time table – Grain Systems PNEG-1915 User Manual
Page 68
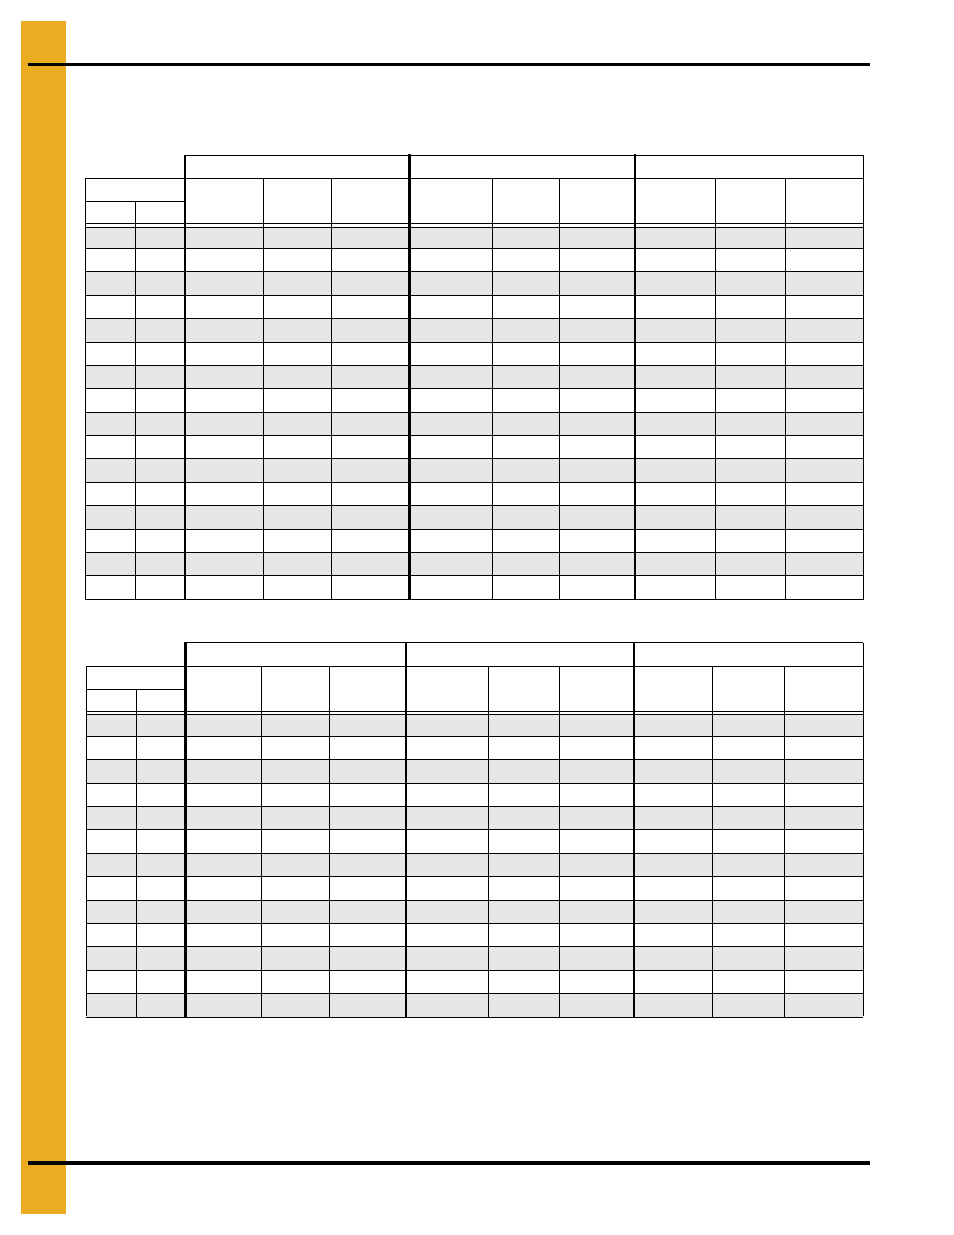
1. Drying Time Table
68
PNEG-1915 VN2 Portable Dryer Drying Charts for All Models of Vision
Drying Time Table……..3414 and 4143
Corn...Dry and Cool (#1 and #2 Cooling)
Corn...Dry and Cool (#1 Cooling)
The above drying capacities are estimates based on drying principles, field results and computer
simulations. Variances may occur due to grain physiological factors (kernel size, chemical composition,
variety, maturity), excessive fines, weather conditions, etc.
170°F
190°F
210°F
Moisture
% Unload
Rate
Dry Time
(Min.)
Capacity
Dry (BPH)
% Unload
Rate
Dry Time
(Min.)
Capacity
Dry (BPH)
% Unload
Rate
Dry Time
(Min.)
Capacity
Dry (BPH)
%
In
%
Out
17
15
73
25
1443
85
22
1683
98
19
1924
18
15
55
34
1087
64
29
1269
74
25
1450
19
15
45
42
887
53
36
1034
60
31
1182
20
15
38
49
753
45
42
879
51
37
1004
21
15
33
56
655
39
48
764
44
42
873
22
15
29
64
577
34
55
673
39
48
769
23
15
26
72
512
30
62
598
35
54
683
24
15
23
81
457
27
69
533
31
60
609
25
15
21
90
409
24
77
477
28
68
545
26
15
19
100
366
22
86
427
25
75
488
27
15
17
112
329
19
96
384
22
84
439
28
15
15
124
296
18
106
346
20
93
395
29
15
14
137
268
16
118
312
18
103
357
30
15
12
152
243
14
130
283
16
114
324
32
15
10
182
202
12
156
236
14
137
269
35
15
8
230
160
9
197
186
11
173
213
170°F
190°F
210°F
Moisture
% Unload
Rate
Dry Time
(Min.)
Capacity
Dry (BPH)
% Unload
Rate
Dry Time
(Min.)
Capacity
Dry (BPH)
% Unload
Rate
Dry Time
(Min.)
Capacity
Dry (BPH)
%
In
%
Out
20
15
51
49
1004
21
15
44
56
873
52
48
1019
22
15
39
64
769
46
55
897
23
15
35
72
683
40
62
797
46
54
911
24
15
31
81
609
36
69
711
41
60
812
25
15
28
90
545
32
77
636
37
68
726
26
15
25
100
488
29
86
570
33
75
651
27
15
22
112
439
26
96
512
30
84
585
28
15
20
124
395
23
106
461
27
93
527
29
15
18
137
357
21
118
417
24
103
476
30
15
16
152
324
19
130
378
22
114
432
32
15
14
182
269
16
156
314
18
137
359
35
15
11
230
213
13
197
248
14
173
284
Drying table based on 100% unload rate of…...1970 BPH