Drying time table – Grain Systems PNEG-1915 User Manual
Page 63
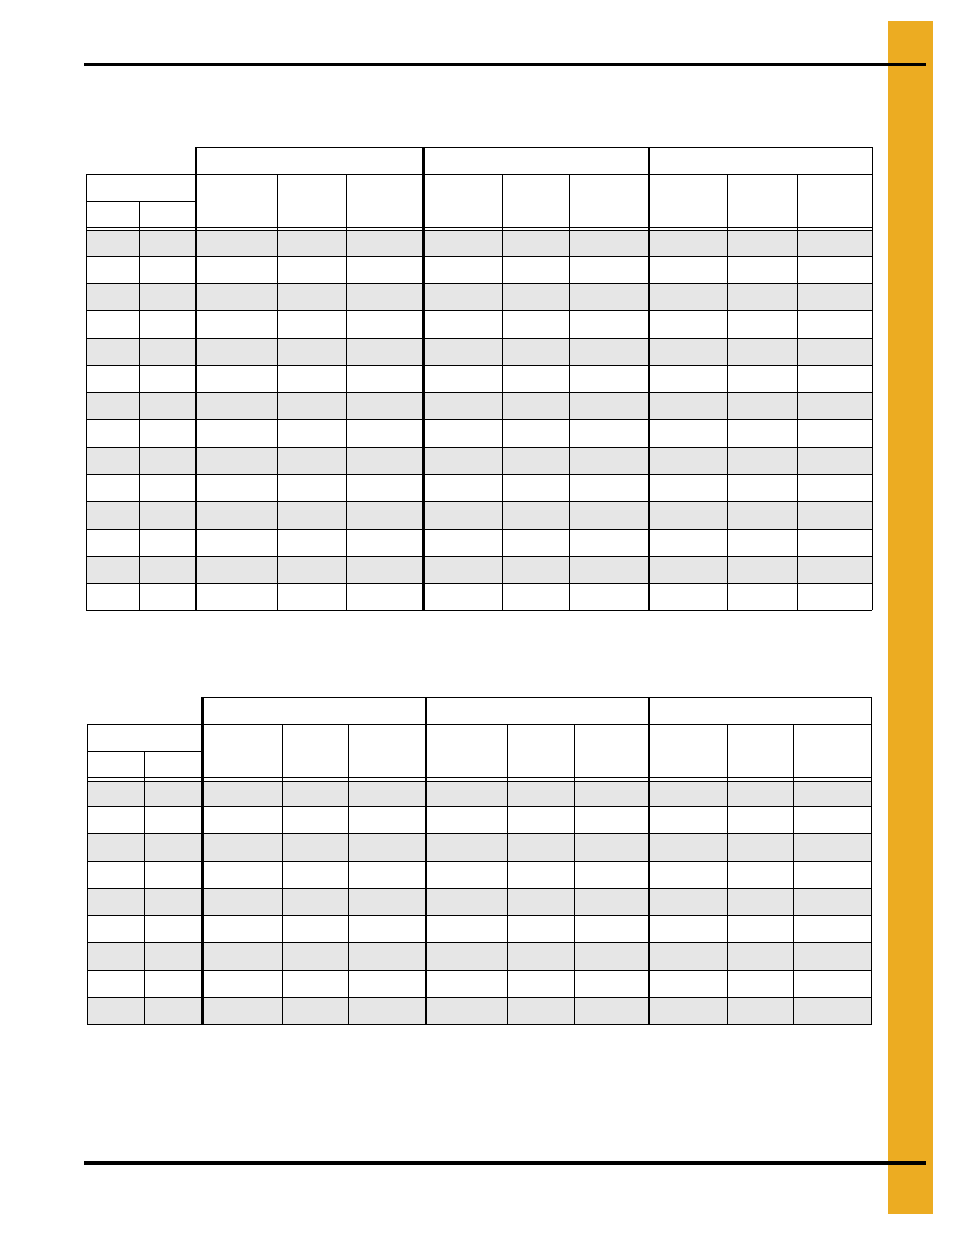
1. Drying Time Table
PNEG-1915 VN2 Portable Dryer Drying Charts for All Models of Vision
63
Drying Time Table……..2326 and 3262 (Continued)
Corn...Full Heat
Wheat, Barley, Milo...Dry and Cool (#1 and #2 Cooling)
The above drying capacities are estimates based on drying principles, field results and computer
simulations. Variances may occur due to grain physiological factors (kernel size, chemical composition,
variety, maturity), excessive fines, weather conditions, etc.
170°F
190°F
210°F
Moisture
% Unload
Rate
Dry Time
(Min.)
Capacity
Dry (BPH)
% Unload
Rate
Dry Time
(Min.)
Capacity
Dry (BPH)
% Unload
Rate
Dry Time
(Min.)
Capacity
Dry (BPH)
In
%
Out*
19
17
100
20
3658
100
21
3658
20
17
83
25
3029
97
22
3534
100
20
3658
21
17
67
31
2464
79
26
2875
90
23
3286
22
17
57
36
2098
67
31
2448
76
27
2798
23
17
50
42
1830
58
36
2135
67
31
2441
24
17
44
47
1617
52
40
1887
59
35
2156
25
17
39
53
1438
46
45
1678
52
40
1918
26
17
35
59
1283
41
51
1497
47
44
1711
27
17
31
66
1147
37
57
1338
42
50
1529
28
17
28
74
1026
33
64
1197
37
56
1368
29
17
25
83
920
29
71
1073
34
62
1226
30
17
23
92
826
26
79
964
30
69
1102
32
17
18
113
674
21
97
786
25
85
899
35
17
14
147
516
16
126
602
19
110
689
*Represents the target moisture out of the dryer. Expected final moisture in the bin is…...15.0%
140°F
155°F
175°F
Moisture
% Unload
Rate
Dry Time
(Min.)
Capacity
Dry (BPH)
% Unload
Rate
Dry Time
(Min.)
Capacity
Dry (BPH)
% Unload
Rate
Dry Time
(Min.)
Capacity
Dry (BPH)
%
In
%
Out
15
13
28
33
1023
33
28
1194
39
24
1421
16
13
21
43
771
25
37
900
29
31
1071
17
13
17
53
629
20
46
734
24
38
873
18
13
15
63
534
17
54
623
20
45
742
19
13
13
72
464
15
62
542
18
52
645
20
13
11
82
409
13
70
477
16
59
568
21
13
10
92
363
12
79
424
14
66
505
23
13
8
115
290
9
99
338
11
83
402
25
13
6
143
233
7
123
272
9
103
324
Drying table based on 100% unload rate of…...3658 BPH