Drying time table…… 6 and 2122, Drying time table – Grain Systems PNEG-1915 User Manual
Page 32
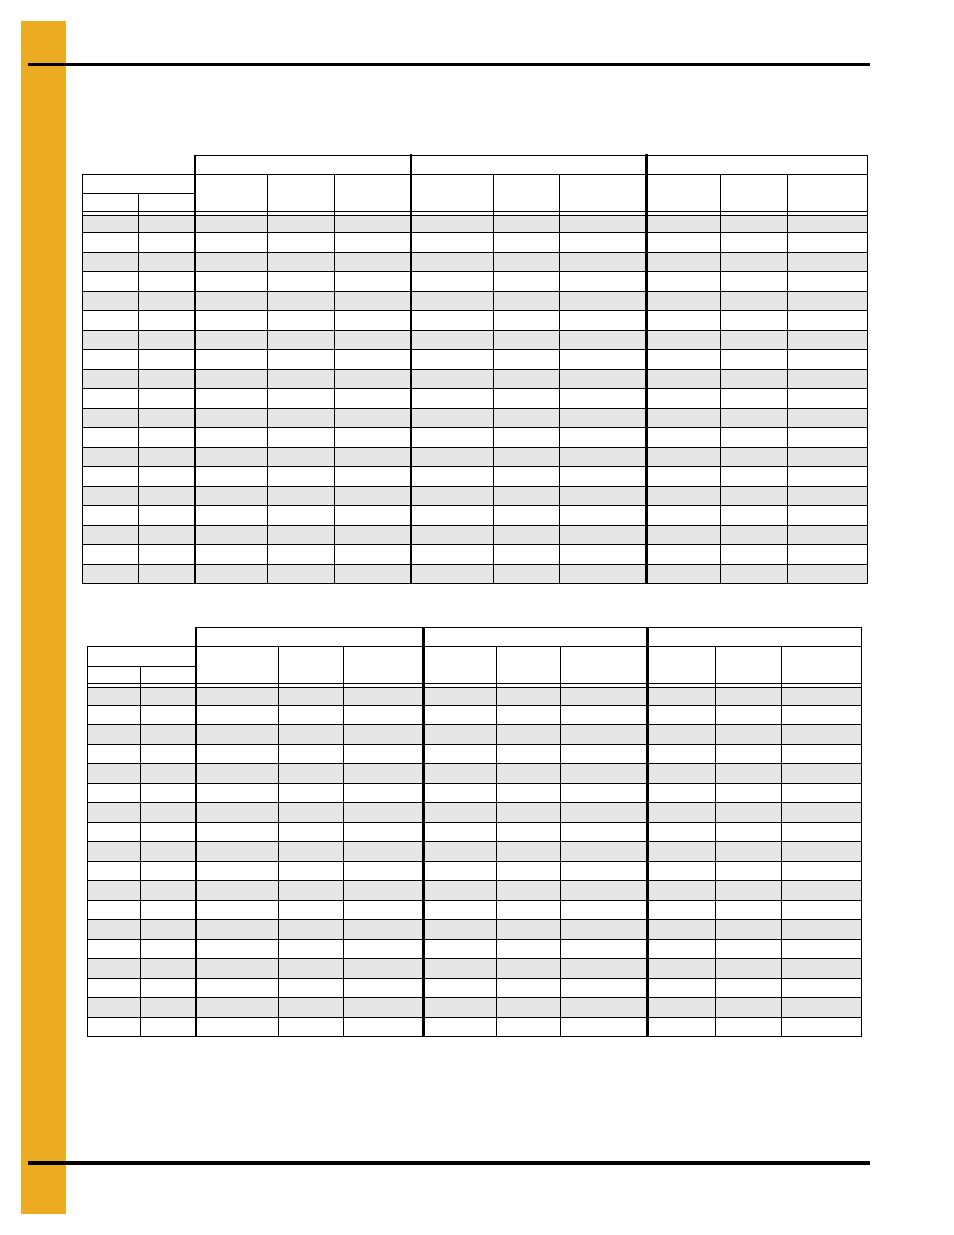
1. Drying Time Table
32
PNEG-1915 VN2 Portable Dryer Drying Charts for All Models of Vision
Drying Time Table……..1216 and 2122
Corn...Dry and Cool
Corn...Full Heat
The above drying capacities are estimates based on drying principles, field results and computer
simulations. Variances may occur due to grain physiological factors (kernel size, chemical composition,
variety, maturity), excessive fines, weather conditions, etc.
190°F
210°F
230°F
Moisture
% Unload
Rate
Dry Time
(Min.)
Capacity
Dry (BPH)
% Unload
Rate
Dry Time
(Min.)
Capacity Dry
(BPH)
% Unload
Rate
Dry Time
(Min.)
Capacity
Dry (BPH)
% In
% Out
17
15
34
20
768
39
17
878
18
15
26
26
579
29
23
662
19
15
21
32
472
24
28
539
27
25
607
20
15
18
38
401
20
33
458
23
29
515
21
15
15
43
349
18
38
398
20
34
448
22
15
14
49
307
16
43
351
18
38
395
23
15
12
55
273
14
48
312
16
43
351
24
15
11
62
243
12
54
278
14
48
313
25
15
10
69
217
11
61
249
12
54
280
26
15
9
77
195
10
68
223
11
60
251
27
15
8
86
175
9
75
200
10
67
225
28
15
7
95
158
8
83
180
9
74
203
29
15
6
106
143
7
92
163
8
82
183
30
15
6
116
129
7
102
148
7
91
166
31
15
5
128
118
6
112
134
7
99
151
32
15
5
140
108
5
122
123
6
109
138
33
15
4
152
99
5
133
113
6
118
127
34
15
4
165
91
5
144
104
5
128
118
35
15
4
177
85
4
155
97
5
138
109
190°F
210°F
230°F
Moisture
% Unload
Rate
Dry Time
(Min.)
Capacity
Dry (BPH)
% Unload
Rate
Dry Time
(Min.)
Capacity
Dry (BPH)
% Unload
Rate
Dry Time
(Min.)
Capacity
Dry (BPH)
% In
% Out*
18
17
100
11
2251
100
10
2251
19
17
66
15
1481
75
13
1693
85
12
1904
20
17
49
21
1100
56
18
1258
63
16
1415
21
17
40
25
895
45
22
1023
51
20
1151
22
17
34
30
762
39
26
871
44
23
980
23
17
30
34
665
34
30
760
38
26
855
24
17
26
38
587
30
34
671
34
30
755
25
17
23
43
522
27
38
597
30
34
672
26
17
21
48
466
24
42
533
27
38
599
27
17
19
54
416
21
47
476
24
42
535
28
17
17
61
373
19
53
426
21
47
479
29
17
15
68
334
17
59
382
19
53
429
30
17
13
75
300
15
66
343
17
58
386
31
17
12
83
270
14
73
309
15
65
348
32
17
11
92
245
12
81
280
14
72
315
33
17
10
101
223
11
89
254
13
79
286
34
17
9
111
204
10
97
233
12
86
262
35
17
8
120
188
10
105
214
11
94
241
*Represents the target moisture out of the dryer. Expected final moisture in the bin is…...15.0%
Drying table based on 100% unload rate of…...2251 BPH