The configuration/debug menu – ProSoft Technology 5205-104S-PDPS User Manual
Page 72
4205/5205-TS-104S-PDPS ♦ ProLinx Standalone
Diagnostics and Troubleshooting
IEC-60870-5-104 to PDPS Communication Module with Time Stamp
Page 72 of 128
ProSoft Technology, Inc.
July 12, 2007
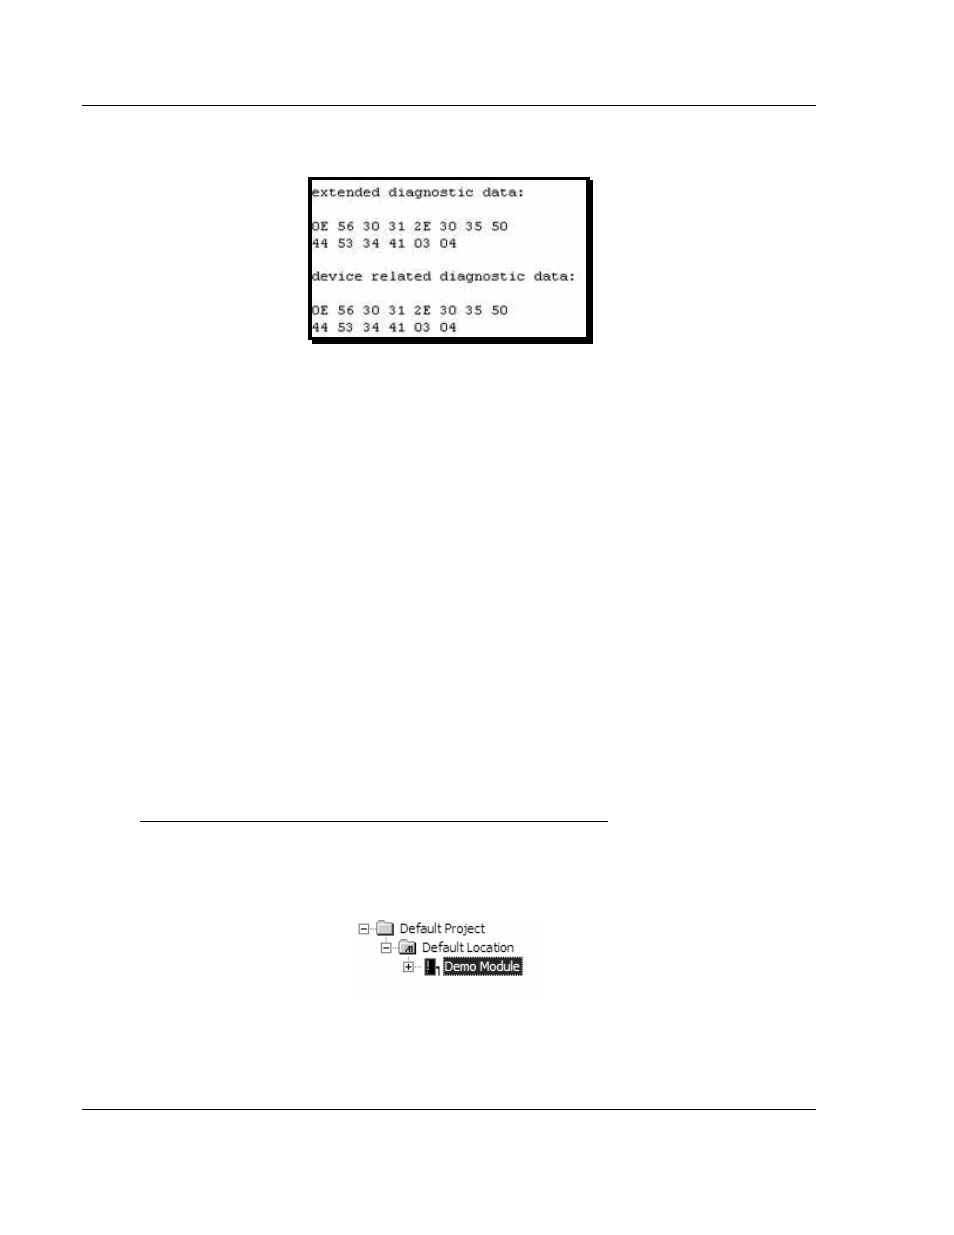
Sample Diagnostics reported to master.
Translated as follows:
Extended diagnostics length
0E= 14 bytes, Product Version 56 = "V", 30 =
"0", 31 = "1", 2E = ".", 30 = "0", 35 = "5", Product Name 50 = ""P", 44 = ""D", 53
= "S", 34 = "4" (MVI46),
Status Register [0]
41 = SPC3 in passive idle and WD-State is in DP_Control
State, Status Register [1] 03 = 1.5 Baud rate, Module State 04 = not in data
exchange
3.1.1 The
Configuration/Debug
Menu
The Configuration and Debug menu for this module is arranged as a tree
structure, with the Main Menu at the top of the tree, and one or more sub-menus
for each menu command. The first menu you see when you connect to the
module is the Main menu.
Because this is a text-based menu system, you enter commands by typing the
command letter from your computer keyboard in the diagnostic window in
ProSoft Configuration Builder (PCB). The module does not respond to mouse
movements or clicks. The command executes as soon as you press the
command letter — you do not need to press [Enter]. When you type a command
letter, a new screen will be displayed in your terminal application.
Using the Diagnostic Window in ProSoft Configuration Builder
To connect to the module's Configuration/Debug serial port:
1
Start PCB program with the application file to be tested. Right click over the
module icon.