Description of the buttons – HEIDENHAIN PWM 20 User Manual
Page 74
November 2014
Software description
75
Characteristics of
the incremental
signals
(bar diagram)
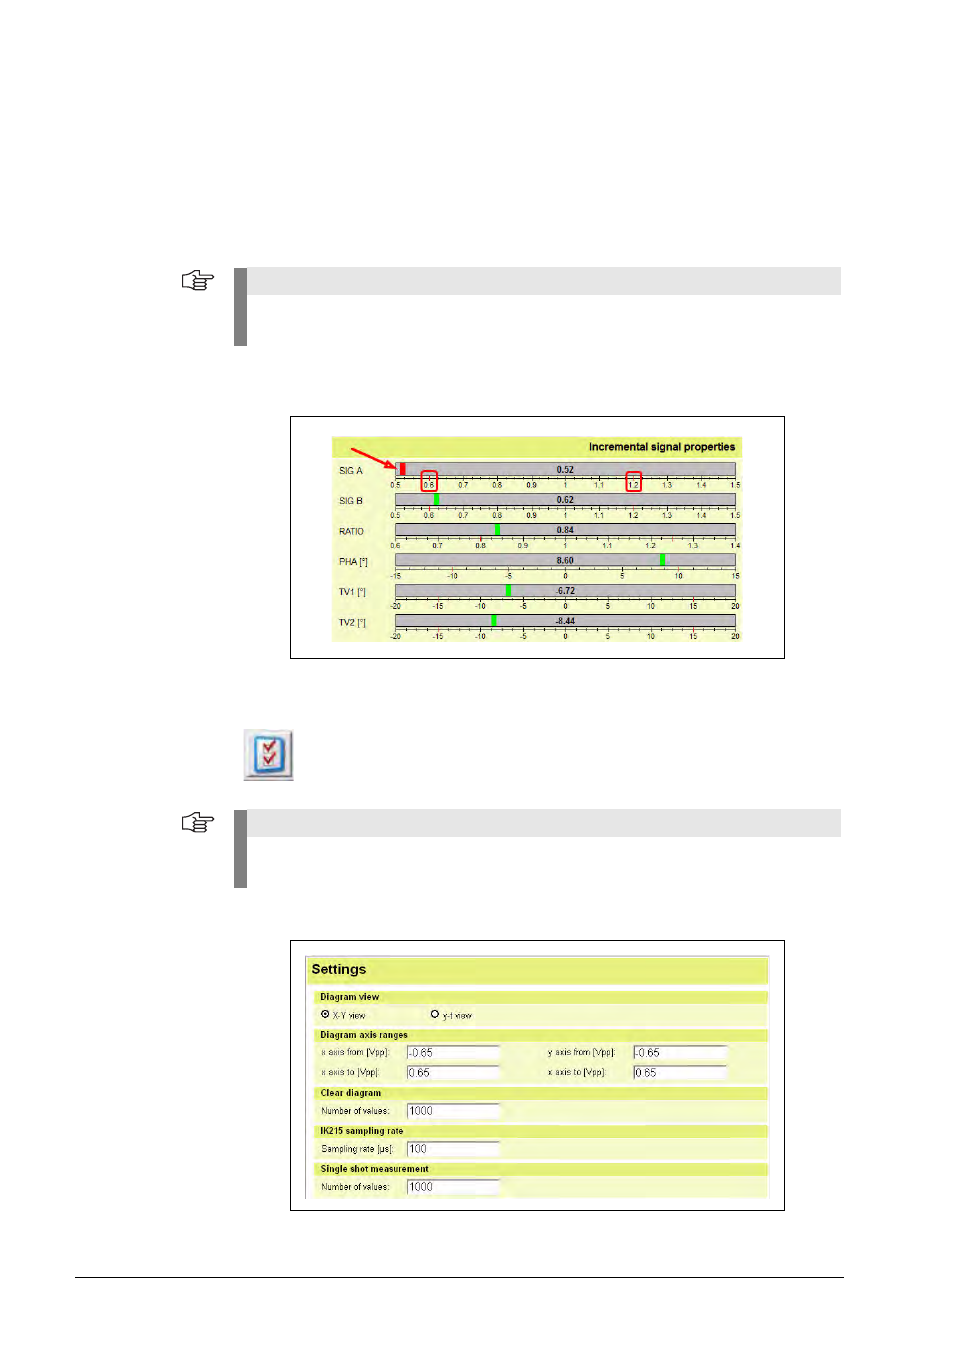
If the signal tolerances are within the specifications (tolerances: see interface description, e.g.
in the product catalog), the bars are displayed in green color; if the tolerances are exceeded the
color changes to red.
The position of the colored markers ("bars") indicates the measured value on the scale. The
current values are also displayed as decimals (in the example: Signal B = 0.56 Vpp; signal is out
of tolerance and therefore displayed in red).
The image below shows the red bars indicating that a tolerance was exceeded.
Information on the scaling and the names of the bars are displayed in context boxes that open
when you position the mouse pointer on a designation of a bar.
Description
of the buttons
In the Service option, the following buttons are additionally active:
Settings for X-Y display:
Note
Red lines on the scale (see frames in the picture below) mark the tolerance range (standard
values).
This buttons opens the "Settings" window.
You can make changes in 5 categories.
Note
Resetting to factory default is not possible!
The next two screenshots of the "Settings" show the default condition (factory setting).