HEIDENHAIN PWM 20 User Manual
Page 169

172
HEIDENHAIN ATS Software User's Manual
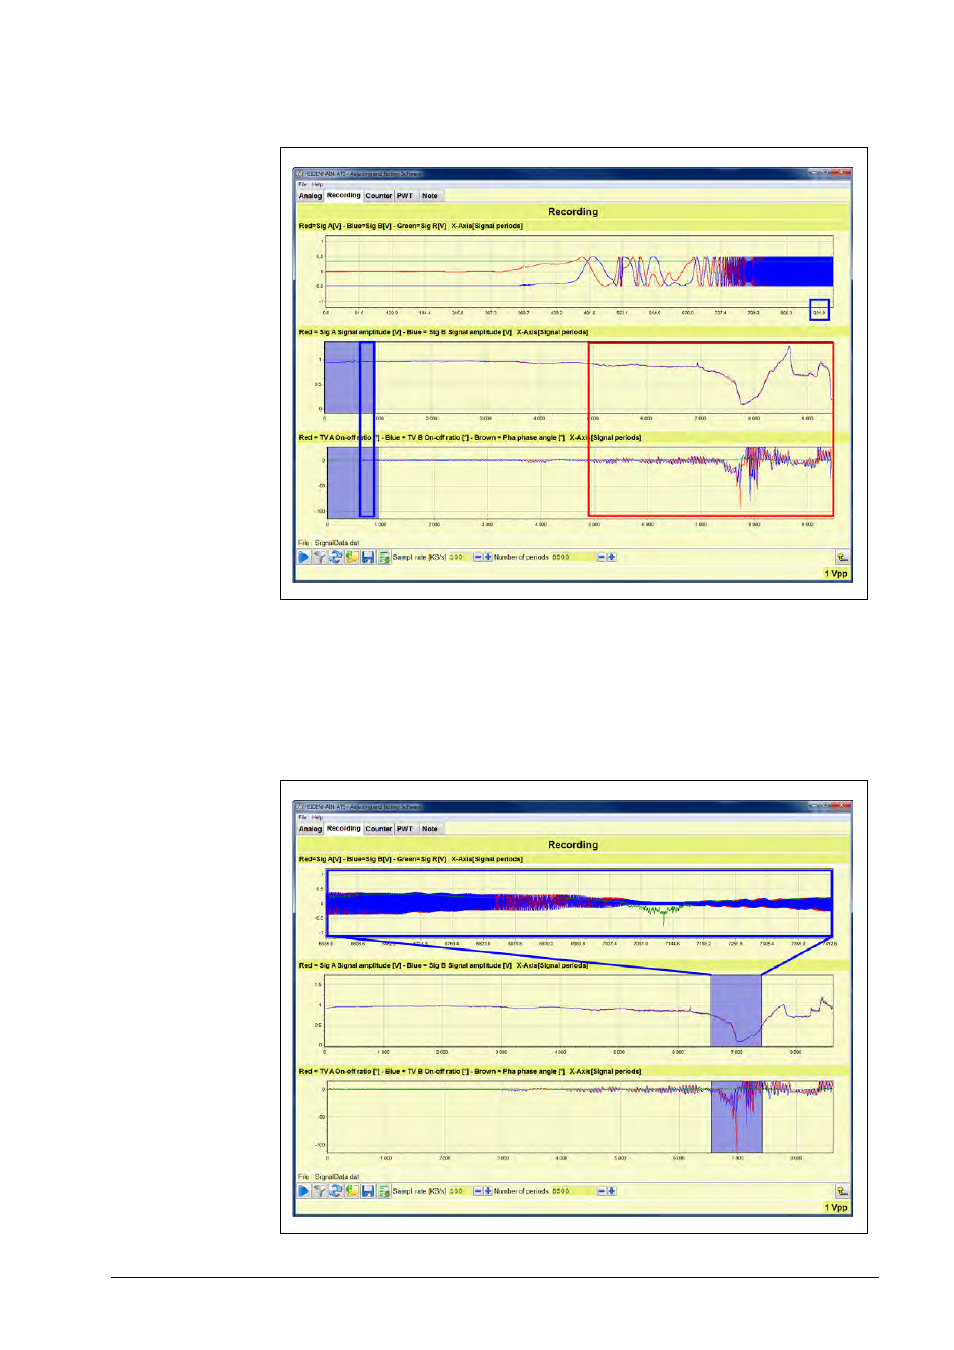
The image below shows the record of a linear encoder with heavy contamination.
Area in the red square:
Signal drop and extreme on-off ratio and phase shift errors at the end of the measuring range.
The blue rectangles show that the upper diagram only contains a section of the signal train.
In the lower diagrams, this section is at the beginning of the measurement (about 1000 periods
out of 8500).
By means of the blue areas you can also display the right side of the diagram in detail (the zoom
function can be used in addition).
See also other documents in the category HEIDENHAIN Equipment:
- TNC 122 User Manual (63 pages)
- TNC 122 Technical Manual (70 pages)
- TNC 360 Service Manual (157 pages)
- TNC 416 Technical Manual (510 pages)
- TNC 335 Technical Manual (581 pages)
- TNC 360 User Manual (237 pages)
- TNC 360 ISO-Programmierung (2 pages)
- TNC 415 (280 540) User Manual (227 pages)
- TNC 370D (92 pages)
- TNC 416 (289 pages)
- TNC 415 (280 540) Technical Manual (752 pages)
- TNC 415 (259 96x) Service Manual (195 pages)
- TNC 407 (280 580) User Manual (376 pages)
- iTNC 530 (340 420) Pilot (104 pages)
- TNC 407 (280 580) ISO Programming (333 pages)
- TNC 415 (280 540) Service Manual (252 pages)
- PT 880 Installation (112 pages)
- ND 100 User Manual (116 pages)
- ND 287 User Manual (147 pages)
- ND 280 Quick Start (12 pages)
- ND 200 (156 pages)
- ND 282 (10 pages)
- ND 287 Quick Start (26 pages)
- ND 282 B (39 pages)
- ND 281 A (44 pages)
- ND 281 B v.1 (53 pages)
- ND 281 B v.2 (65 pages)
- ND 221 v.2 (10 pages)
- ND 231 B v.2 (56 pages)
- ND 231 B v.1 (44 pages)
- ND 221 B v.2 (45 pages)
- ND 550 v.2 (8 pages)
- NDP 560 (10 pages)
- ND 523 (93 pages)
- ND 570 (8 pages)
- ND 750 v.2 (46 pages)
- ND 760 v.3 (72 pages)
- ND 770 v.1 (40 pages)
- ND 770 v.3 (41 pages)
- ND 760 E (44 pages)
- IOB 49 (21 pages)
- NDP 960 (68 pages)
- ND 780 Installation (132 pages)
- ND 970 (47 pages)
- ND 1100 Quick Start (36 pages)
