6 recording function – HEIDENHAIN PWM 20 User Manual
Page 164
November 2014
Checking incremental encoders
167
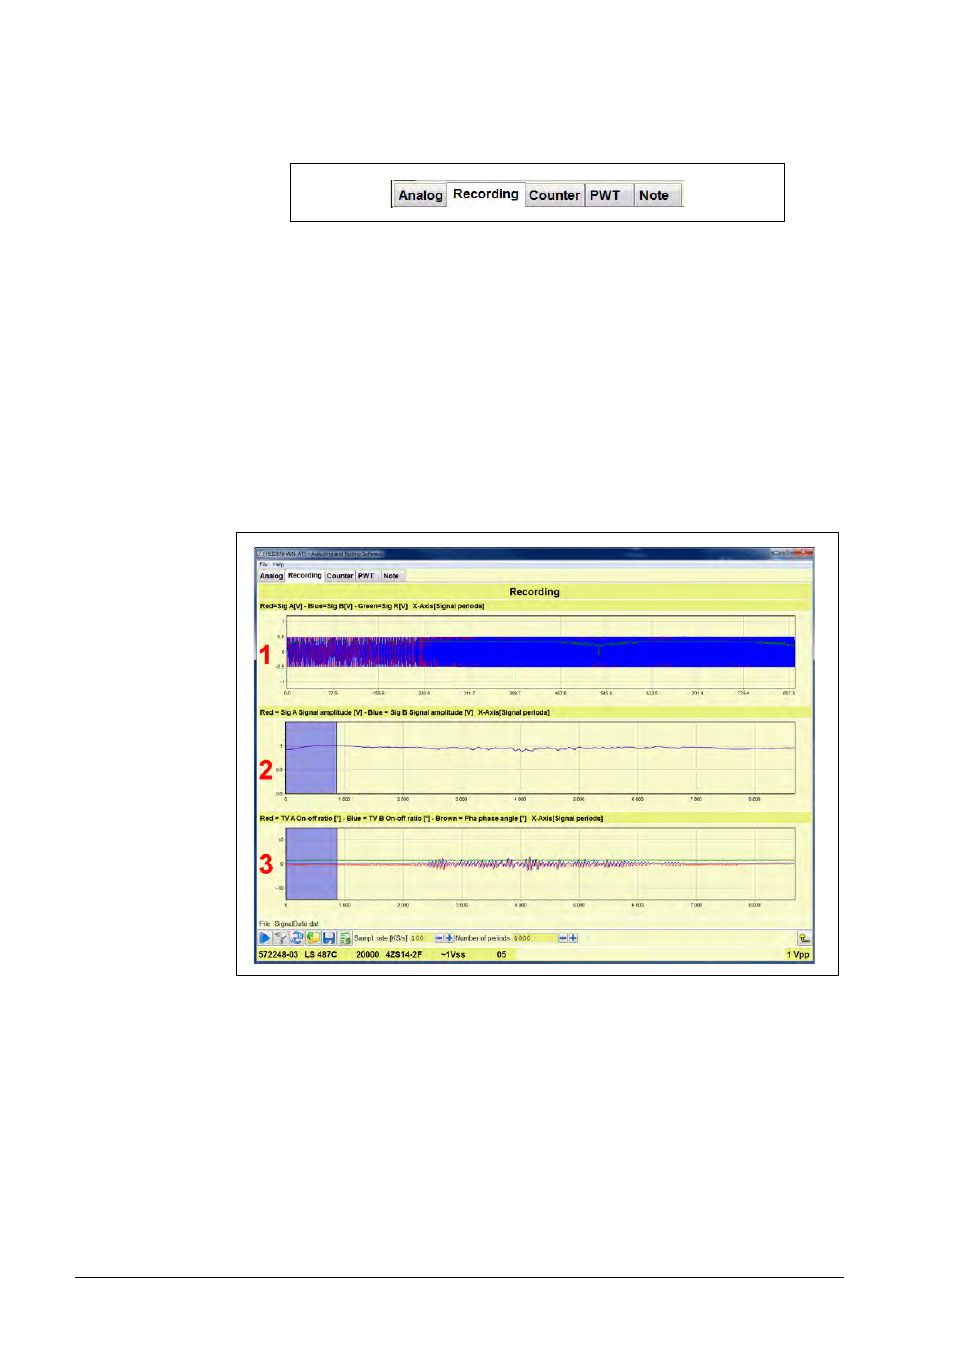
6.2.6 Recording function
With the "Recording" function, the output signal can be diagnosed over several signal periods
(SP). The number of periods that determines the measuring range to be inspected must be
entered by hand. The test data can be saved, loaded and exported. The measuring results are
displayed in three diagrams for further analysis of the signals.
The three diagrams fields show the differences of the sinusoidal and cosinusoidal signals.
Recorded data:
Amplitude
Signal shape
Differences in amplitude (A/B)
On-off ratio TV 1 / TV 2, also referred to as offset
Phase shift between sine and cosine signals
Diagram 1
Partial display of the signal periods = Number of periods (X axis)
As there are very many data, only a subset is displayed (10% of the raw data; 1000 signal periods
maximum).
Y = Amplitude height in [Vpp] or [µApp]
Depending on the depicted area, no reference mark may be visible!
Ideal signal: The amplitudes are symmetrical to Y = 0 and within the tolerance limits.
Red = Sinusoidal signal 0°
;
Blue = Sinusoidal signal 90°
;
Green = Reference mark signal
Diagram 2
Display of the amplitude heights over all signal periods (Y axis in [Vpp] or [µApp];
X axis = Number of signal periods
Ideal signal: The two signal curves should almost coincide; they may diverge within the
tolerance limits.
Red = Signal amplitude 0° [V]
;
Blue = Signal amplitude 90° [V]