7 logic function, bar graphs – HEIDENHAIN PWM 20 User Manual
Page 202
November 2014
Checking incremental encoders
205
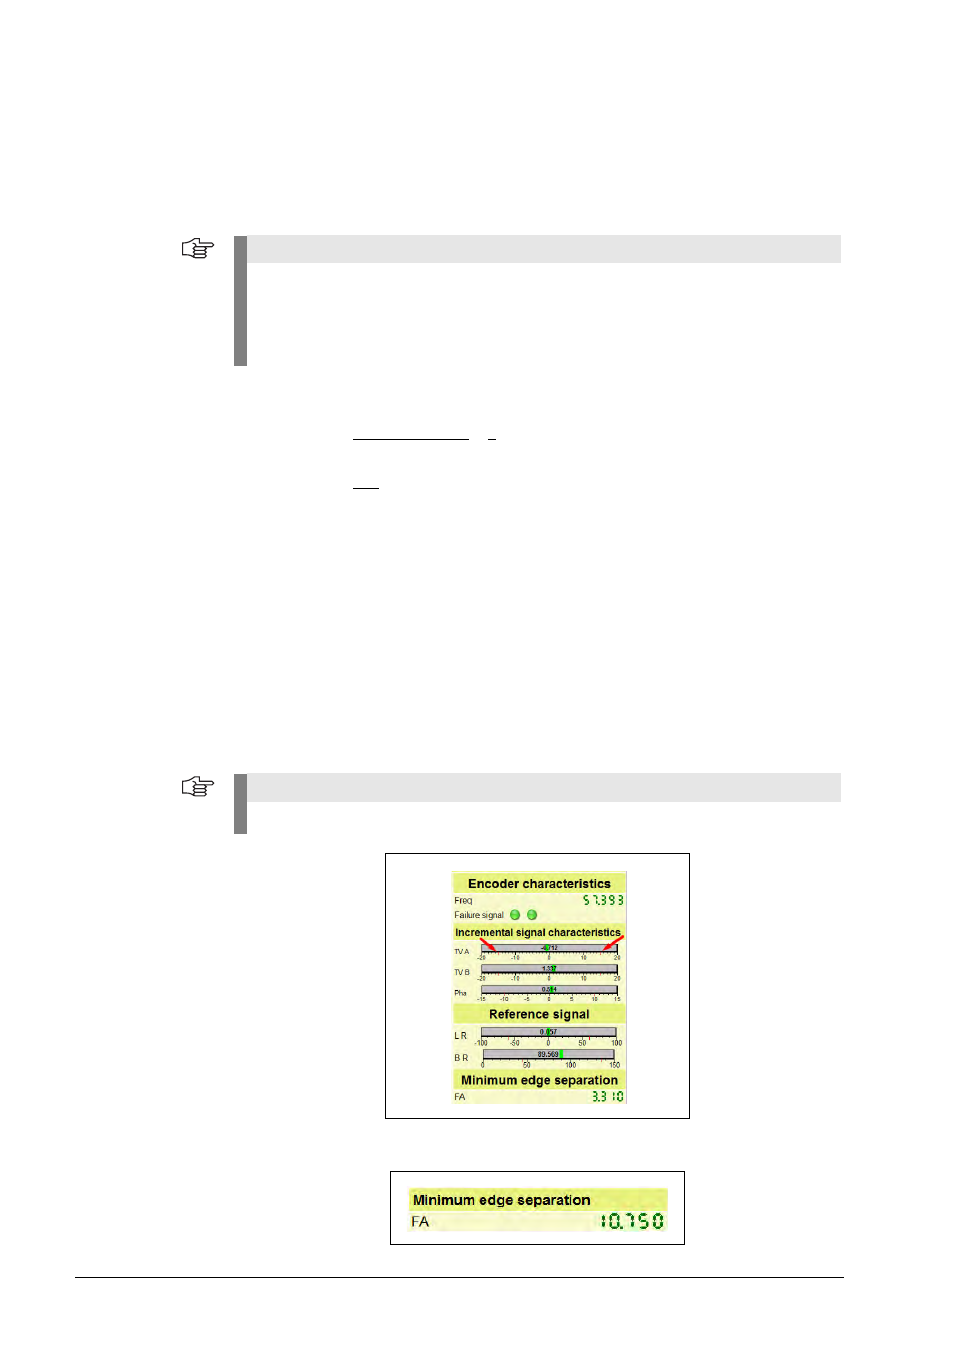
6.3.7 Logic function, bar graphs
The bar graphs include
Measurement of on-to-off ratios TV A / TV B and phase angle
Measurement of REF signal position and width
Measurement of minimum edge separation
Designations of the logic bar graphs:
Colors of the pointers in the bar graphs
The higher the frequency of the output signal becomes, the smaller is the edge separation.
Note
The displays "Incremental signal characteristics" and "Reference signal" are only useful for
encoders that feature non-clocked interpolation (mostly TTLx1 or TTLx2).
For higher interpolation factors, clocked interpolations (TTLx5, x50, x200 ...) are used in most
cases. The edges of the square-wave signal are falsified and do no longer correspond to the
original signal.
TV A, TV B
On-to-off ratio (Tastverhältnis) = ratio of ON signal to OFF signal
(180° / 180° = 1 : 1) in [°]
Pha
Phase angle difference of signals A and B in [°]
LR
Position error of the reference mark in [°]
BR
Width of the reference mark in [°]
FA
Minimum edge separation in [µs]
Green bars:
Signals within the specified tolerance
Red bars:
Signals outside the specified tolerance
Multiple
arrows:
Scaling exceeded
Note
The standard tolerance limits are marked by red lines in the bar graphs (see pointers).