Viewing statistics – Grass Valley Network Attached Storage System Serial ATA Network User Guide v.1.0.06 User Manual
Page 78
Viewing Statistics
Digital News Production
77
Viewing Statistics
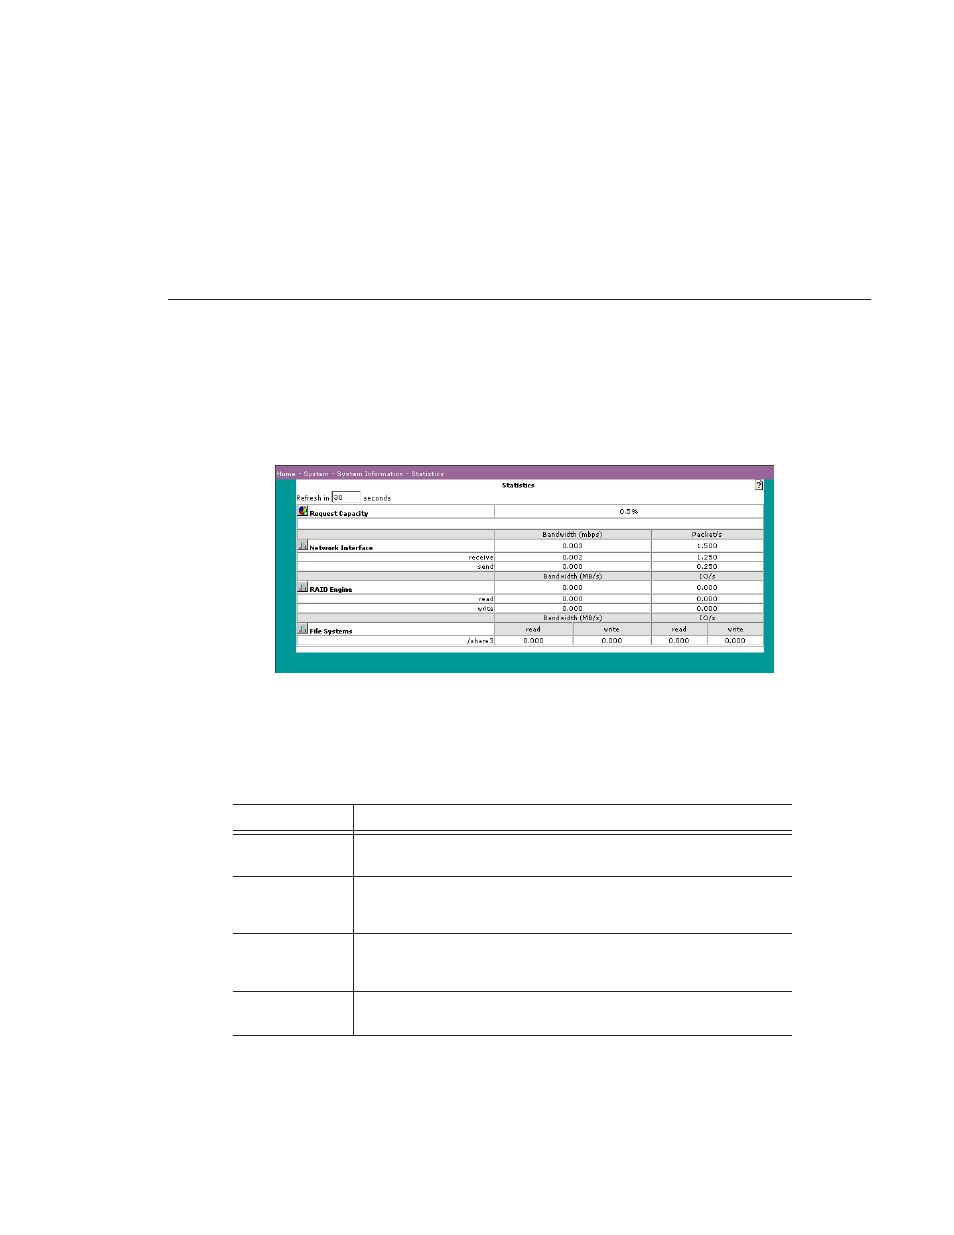
To view performance data, choose
System | System Information | Statistics
.
A Statistics window similar to this window appears:
Enter the refresh interval. The data on this window is updated in intervals of the
number of seconds you entered. Click on the icon to the left of Request
Capacity to graphically view the CPU load. Click on the icons to the left of
Network Interface, RAID Engine, or File Systems to view the performance
statistics graphically. The fields shown are described below:
Field
Description
Request Capacity
Percent of processing capacity that is used. 0% means there is no capacity
available. 100% means that no processing capacity is available.
Network Interface
Data transfer between a client and the appliance. Separately, for receive and
send, it shows: Bandwidth, measured in megabits per second and packets
per second.
RAID Engine
Transfer rates from the disk array. Separately, for read and for write, it
shows: Bandwidth, measured in megabytes per second and input or output
(I/O) per second.
File Systems
Transfer rates for each file system. For read and write, it shows: Bandwidth,
measured megabytes per second and input or output (I/O) per second