Managing the nqa instance topology – H3C Technologies H3C Intelligent Management Center User Manual
Page 46
37
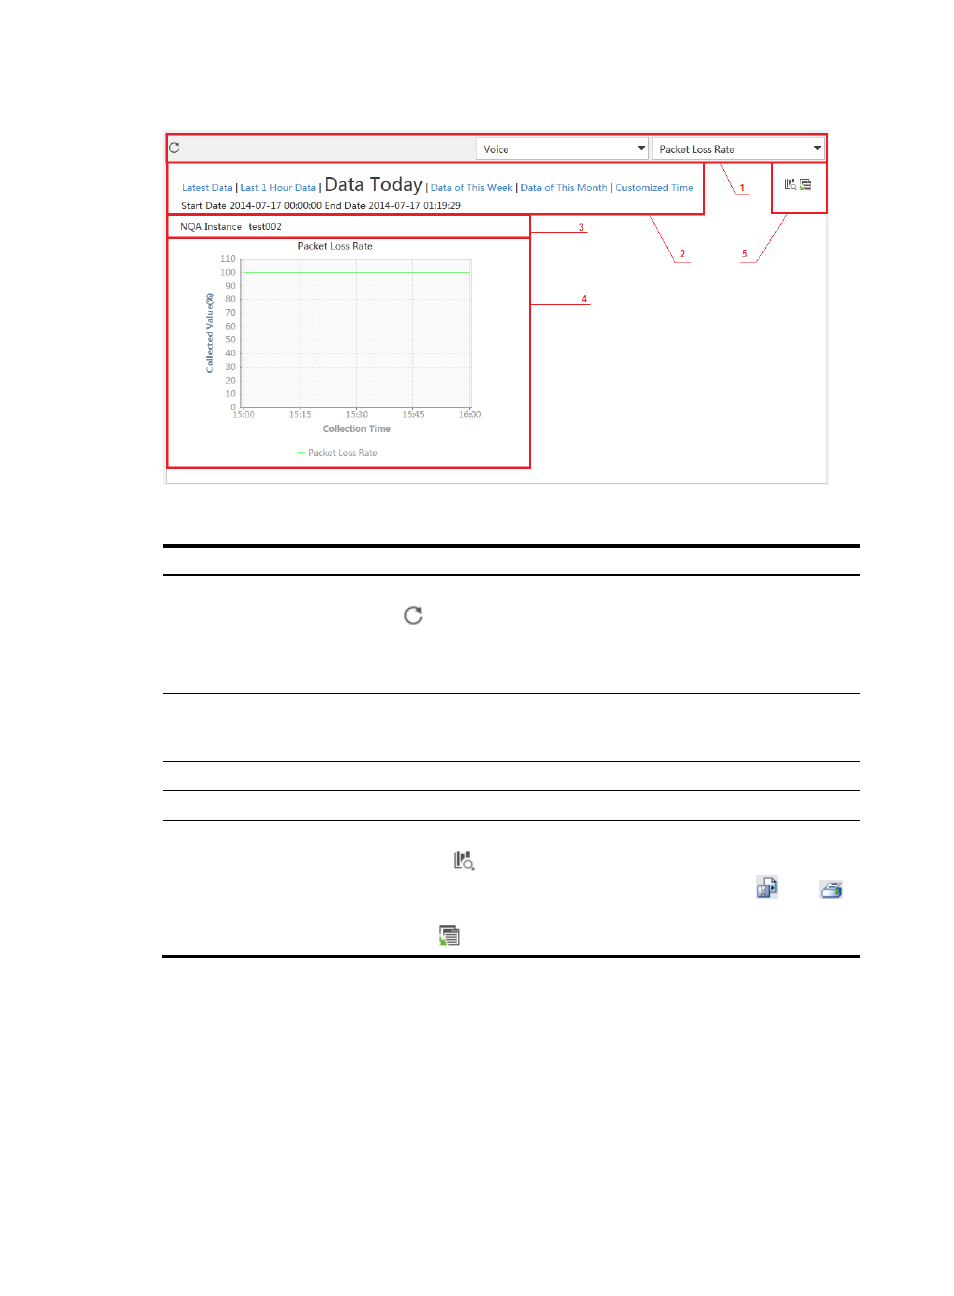
Figure 14 A detail report for an NQA instance
Table 5 Description of the detail report fields
No. Description
1
The area provides the following operations:
•
Click the Refresh icon
to view the most recent report.
•
Select a basic index and performance index you want to view from the basic index list and
performance index list, respectively. In this example, the basic index and performance index are
Voice and Packet Loss Rate, respectively.
2
Click a time range for statistics collection. Options are Latest Data, Last 1 Hour Data, Data Today,
Data of This Week, Data of This Month, and Customized Time. The selected time range is displayed
at the bottom of this area. By default, the report of today is displayed.
3 NQA
instance
name.
4
The trend graph shows the changes of the performance index over the collection time in a line chart.
5
The area provides the following operations:
•
Report—Click the Report icon
to view detailed information about the performance index,
including the maximum, minimum, and average values. You can click the icons
and
to export and print the report, respectively.
•
Table—Click the Table icon
to display the report in table.
Managing the NQA instance topology
The NQA instance topology displays the NQA devices and instances in topology, and provides basic
NQA instance management function. For more information about the topology functions and its
supported operations, see HP IMC Enterprise and Standard Platform Administrator Guide.