Responses tab, Questions, Charts – Turning Technologies Response User Manual
Page 68: Responses
______________________________________________________________
Response User’s Guide
68 |
P a g e
Responses Tab
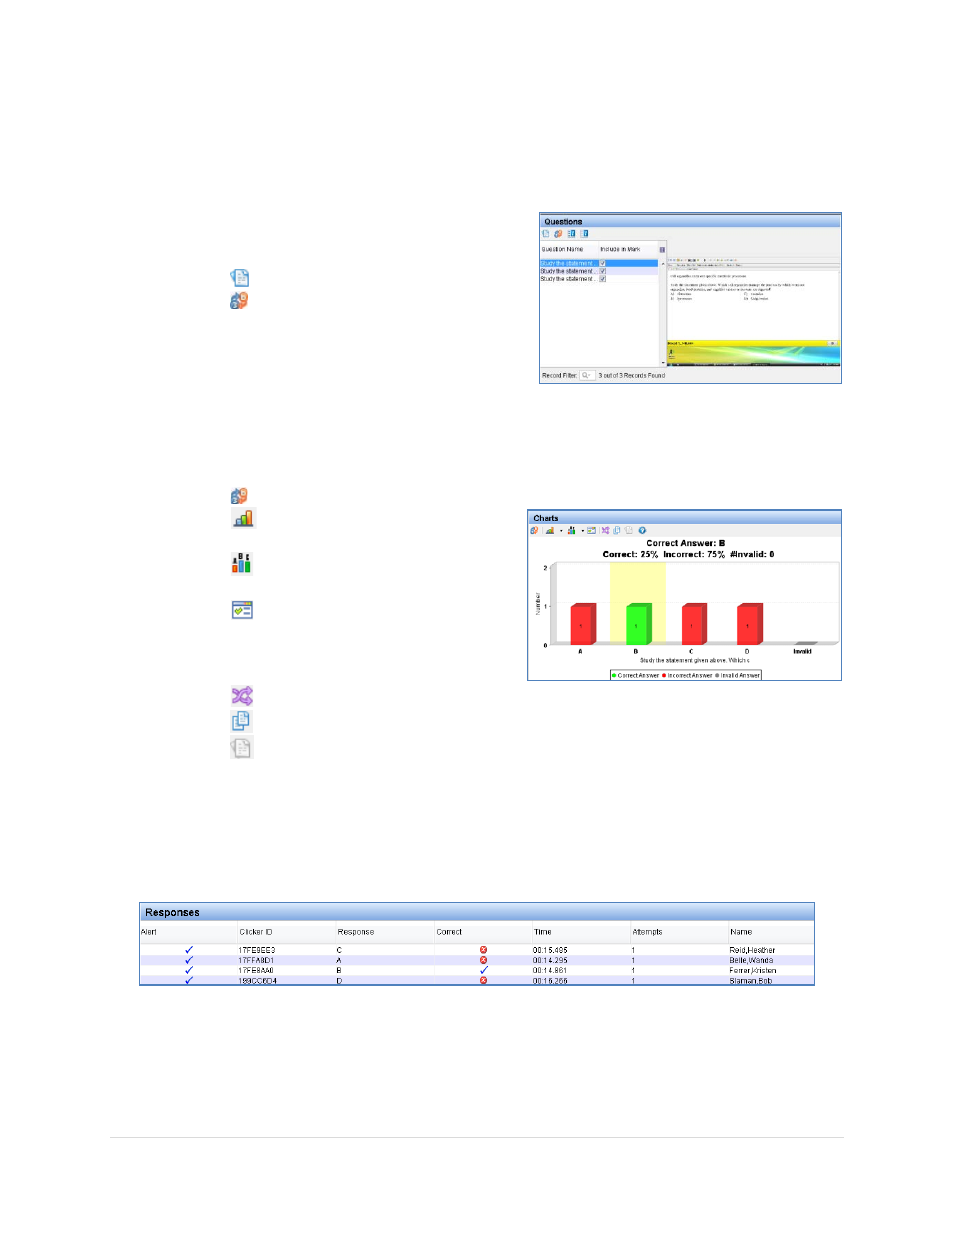
The Responses tab is divided into three panes, Questions, Charts, and Reponses.
Questions
•
view the question
•
edit the question properties
• select the questions you would like to
be part of the marked session
Note
Editing a question will propagate through the existing session.
Charts
•
edit the question properties
•
change the graph to be a bar,
horizontal, or pie chart
•
change the graph to display all
values, top five, or bin values
•
change the chart preferences to
hide/show values as a percentage or
number responded, correct answer,
chart legend, or confidence level
•
slice data from two questions
•
perform side by side question comparisons
•
return to the original question (use this button with slice data and side by
side comparison buttons
Responses
• View students’ answers and other data such as how long it took them answer and
how many times they answered a question